Datasource Tools
Overview
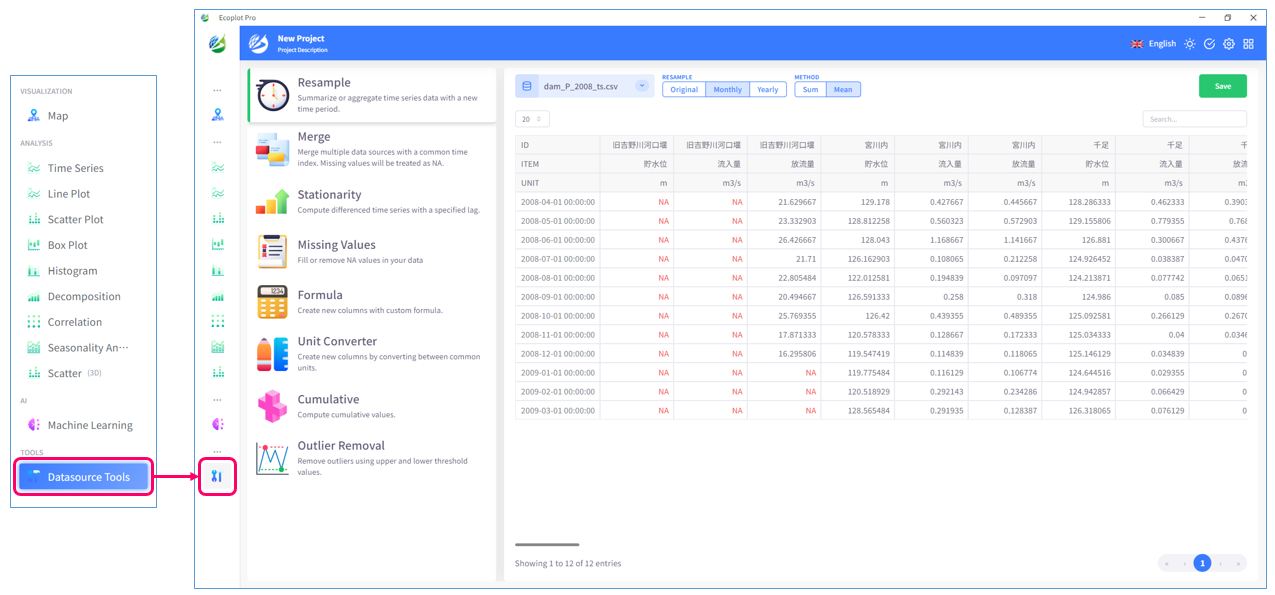
Datasource Tools is a toolbox for processing and converting original time-series data imported into Ecoplot into various secondary data by resampling, accumulating, or missing values handling, etc.
Resample
Resample offers a tool to compress time-series data by summarize or average time series data over a new time period.

Select data to resample
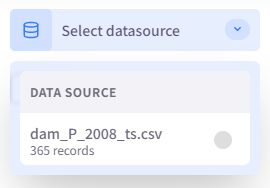
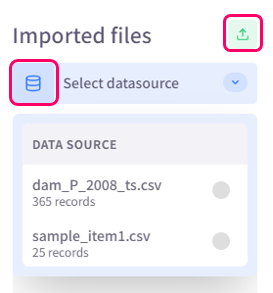
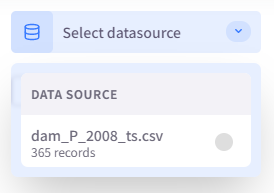
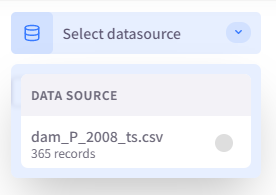
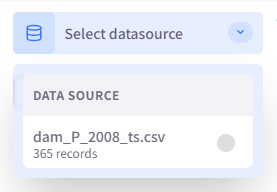
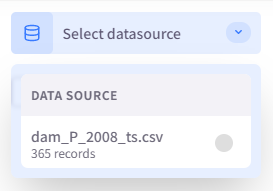
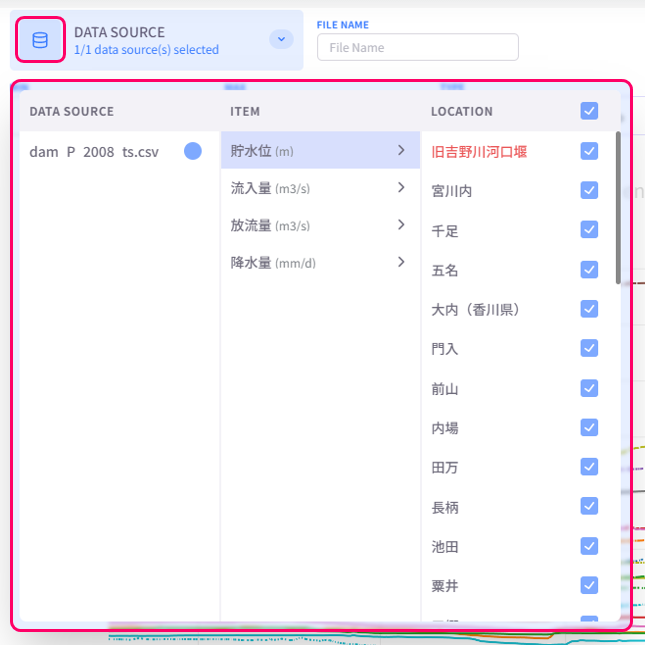
Click the Datasource button on the upper left area of the screen and select the data to resample.
Select resample level and method
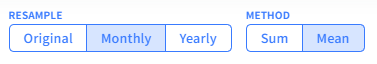
On the upper center area of the screen, select resample level and method.
Preview and save data
Preview the processed data and click the Save button on the upper right corner of the screen to save the processed data as a new datasource. The newly added datasource can be used right away.

Merge
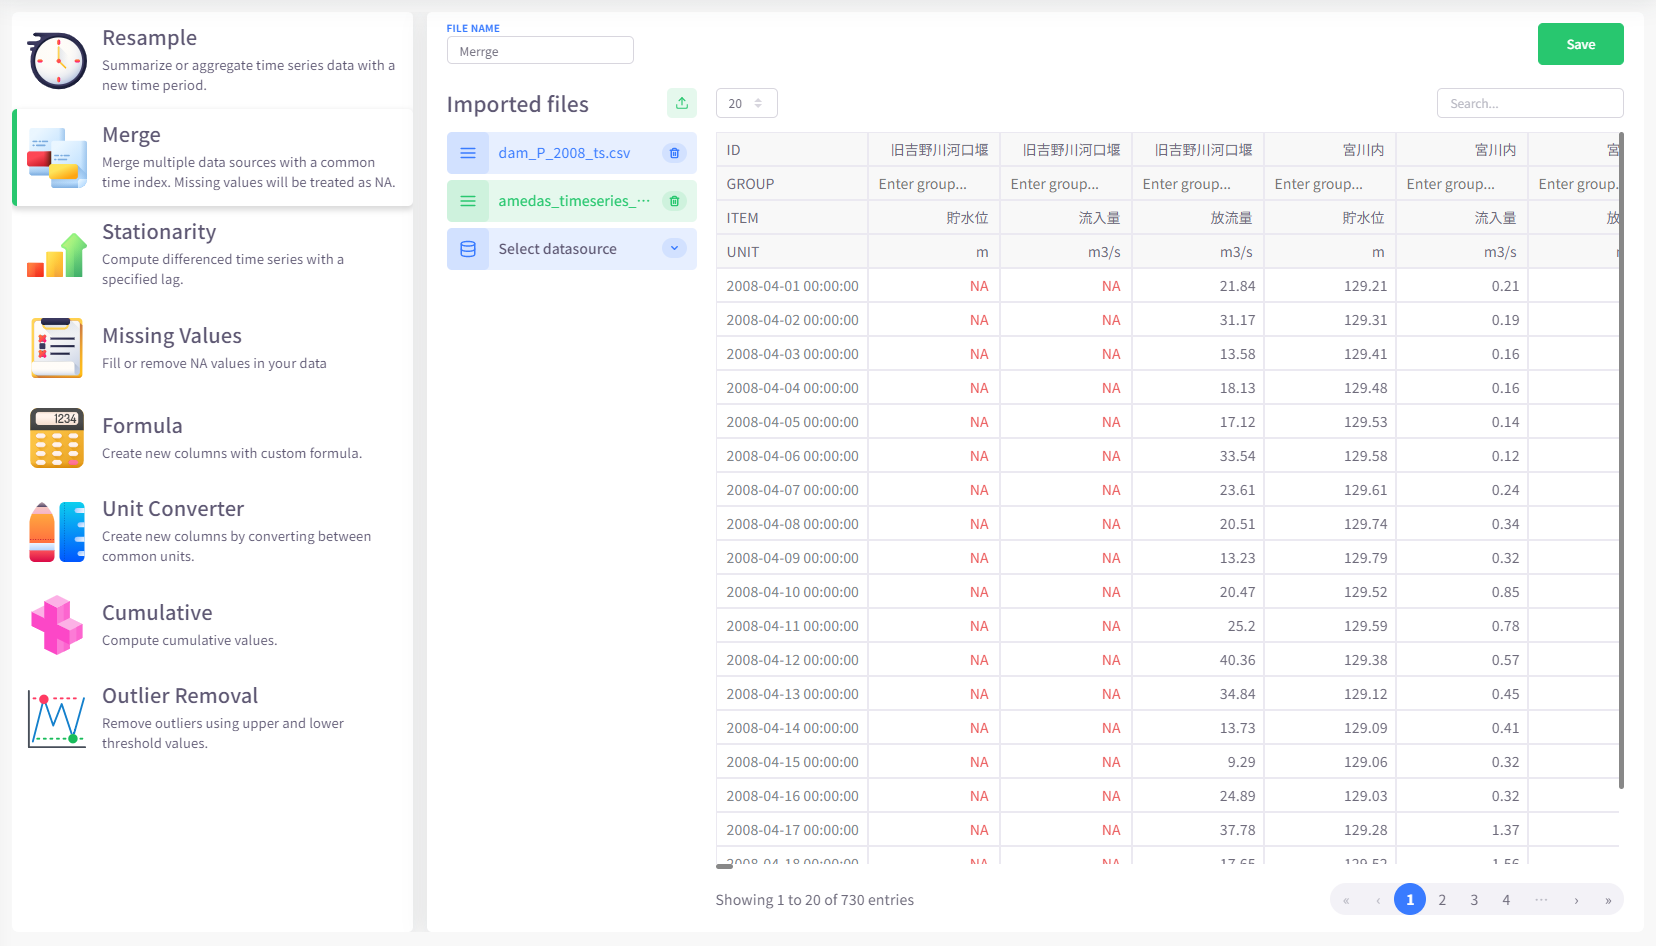
Merge is a tool for merging multiple time-series data into one datasource. Missing values, which may appear due to differences in time indexes, will be treated as NA.
Select or import data to merge
Click the Datasource button on the upper left area of the screen and select the datasources to merge. You can also import files from your computer by clicking the Import button.
Preview and save data
Once the datasources are successfully selected, they will be automatically merged right away. Preview the merged data, then enter a name for it and click the Save button on the upper right corner of the screen to save the merged data as a new datasource. The newly added datasource can be used right away.
Stationarity
Stationarity tool computes time series with a specified lag.

Select data to calculate
Click the Datasource button on the upper left area of the screen and select the data to calculate.
Configure offset
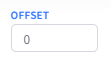
On the upper center area of the screen, specify an offset level for stationarity to start calculating. The value must be a positive integer.
Missing Values
Missing Values is a tool for handling missing values (or "NA") by filling or removing them from your data.
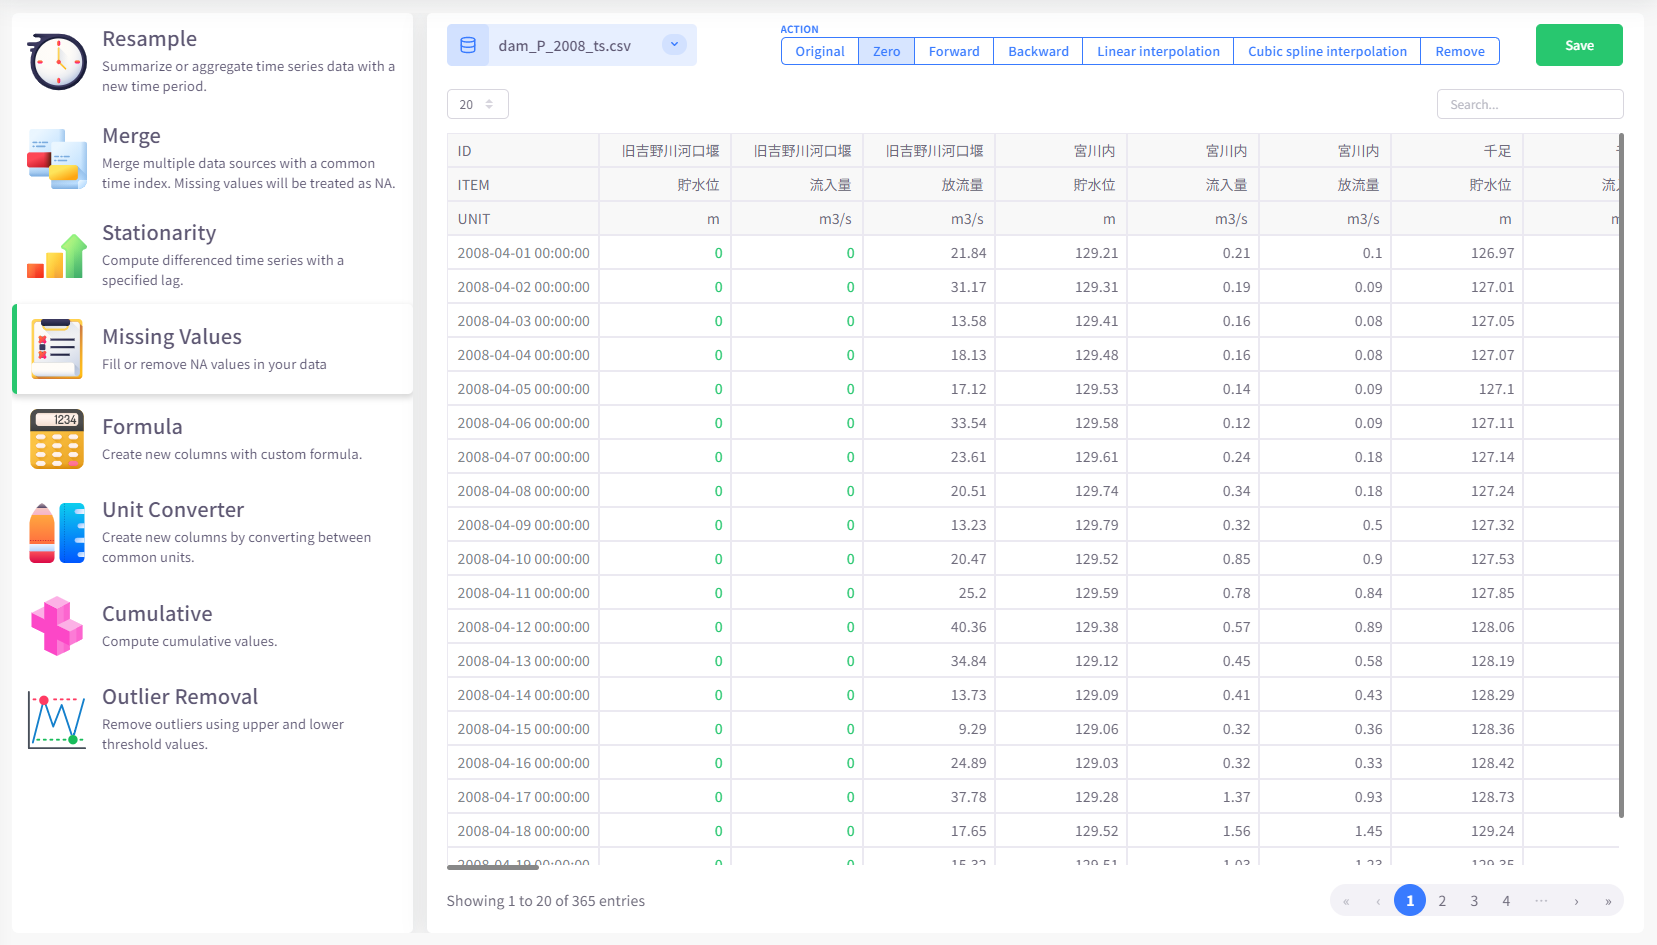
Select data to process
Click the Datasource button on the upper left area of the screen and select the data to process.
Select method
On the upper center area of the screen, select a method to process missing values.

How different methods work is described below:
- Zero: fill all missing values by 0
- Forward: fill missing values by the value of the data entry before them
- Backward: fill missing values by the value of the data entry after them
- Linear interpolation: fill missing values based on the value of all data entries of the same data item
- Cubic spline interpolation: fill missing values almost in the same way as linear interpolation but more smoothly
- Remove: remove all time indexes that contain NA value
Formula
Formula is a useful tool for adding new data entries that are calculated based on existing data.
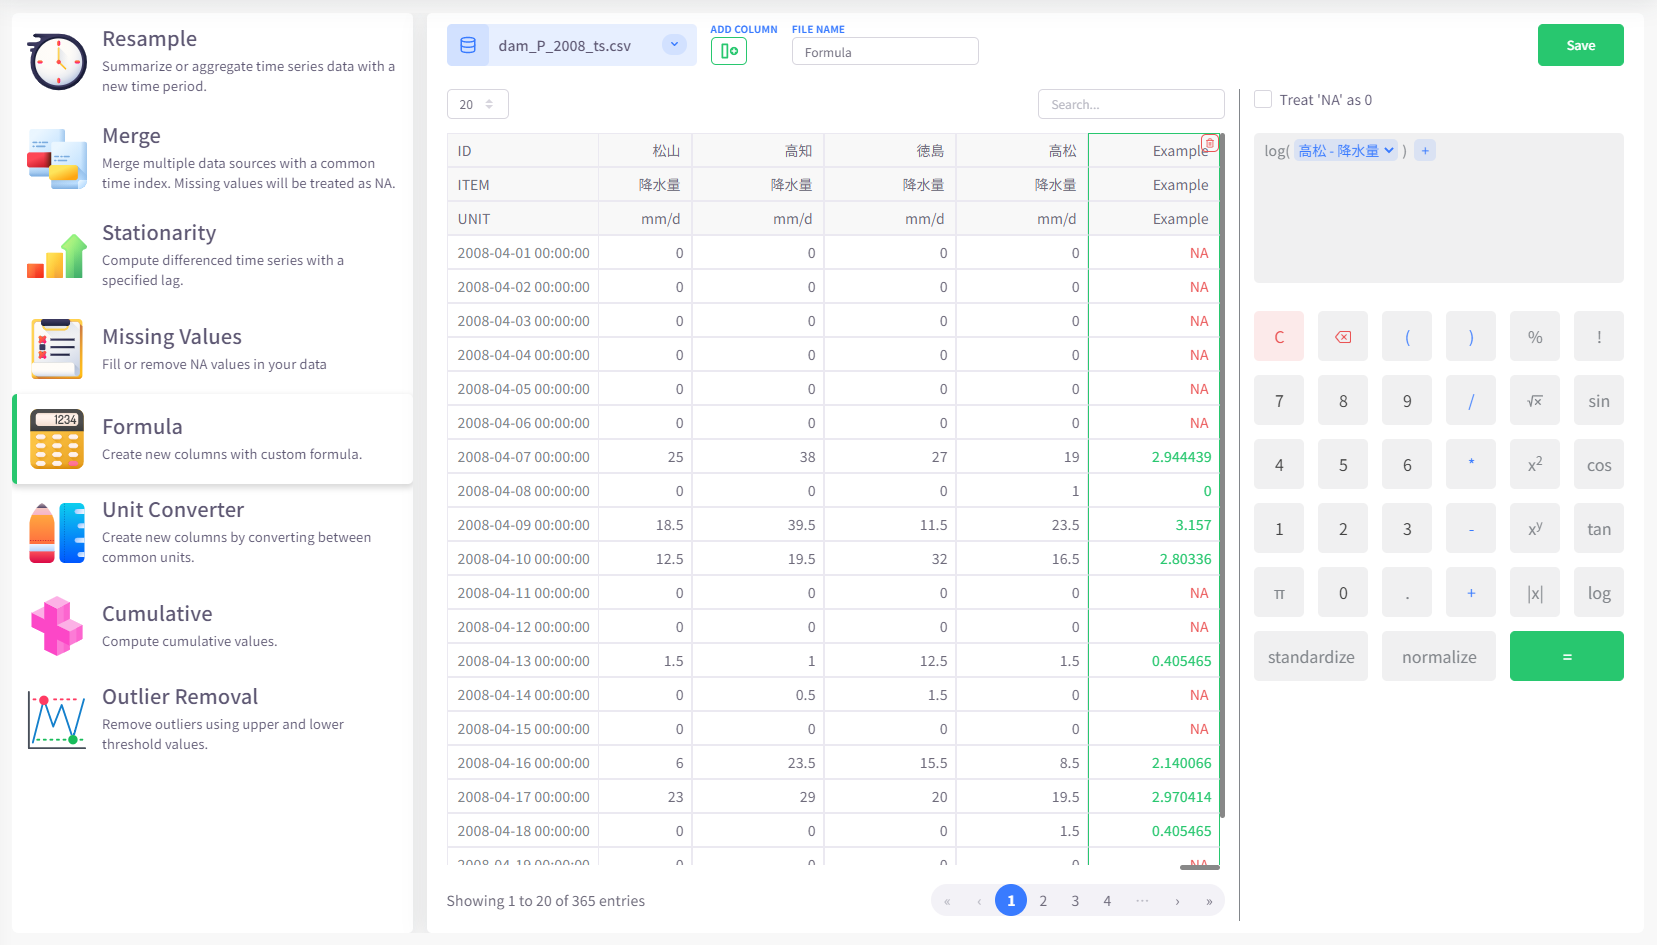
Select data to calculate
Click the Datasource button on the upper left area of the screen and select the data to calculate.
Add blank column
Click the Add Column button on the upper left area of the screen to add a blank column to the end of the data table. Calculated data will be written into this column. You can add multiple columns at the same time.

Enter formula
On the calculator panel on the right side of the screen, enter your formula, and then click the "=" button to calculate and show result. If you have multiple blank columns added, you should specify the one for each formula.
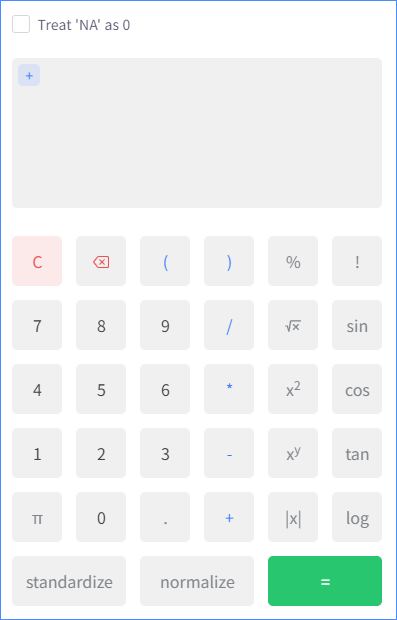
If your original datasource contains missing values (or "NA"), you can check the option "Treat "NA" as 0" so that all NA values will be assigned to value 0 when being calculated.
Unit Converter
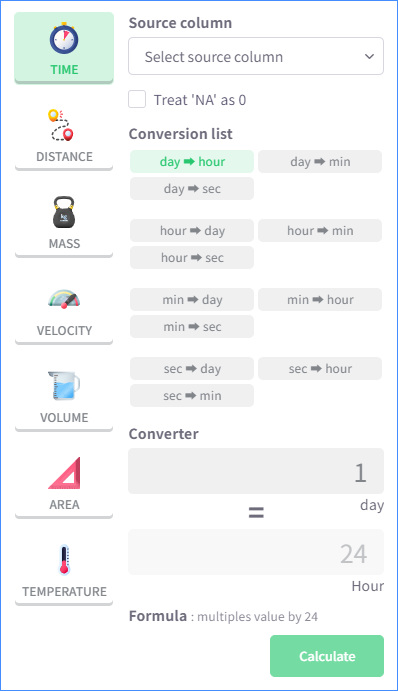
Unit Converter is used for calculating data of one unit into those of other unit. Currently, Ecoplot supports converting units of the following types: time, distance, mass, velocity, volume, area, and temperature.

Select data to calculate
Click the Datasource button on the upper left area of the screen and select the data to calculate.
Add blank column
Click the Add Column button on the upper left area of the screen to add a blank column to the end of the data table. Calculated data will be written into this column. You can add multiple columns at the same time.
Select source column and converter
On the converter panel on the right side of the screen, select a source column, choose a suitable unit converter, and then click the Calculate button to convert and show result. If you have multiple blank columns added, you should specify the one for each converting attempt.
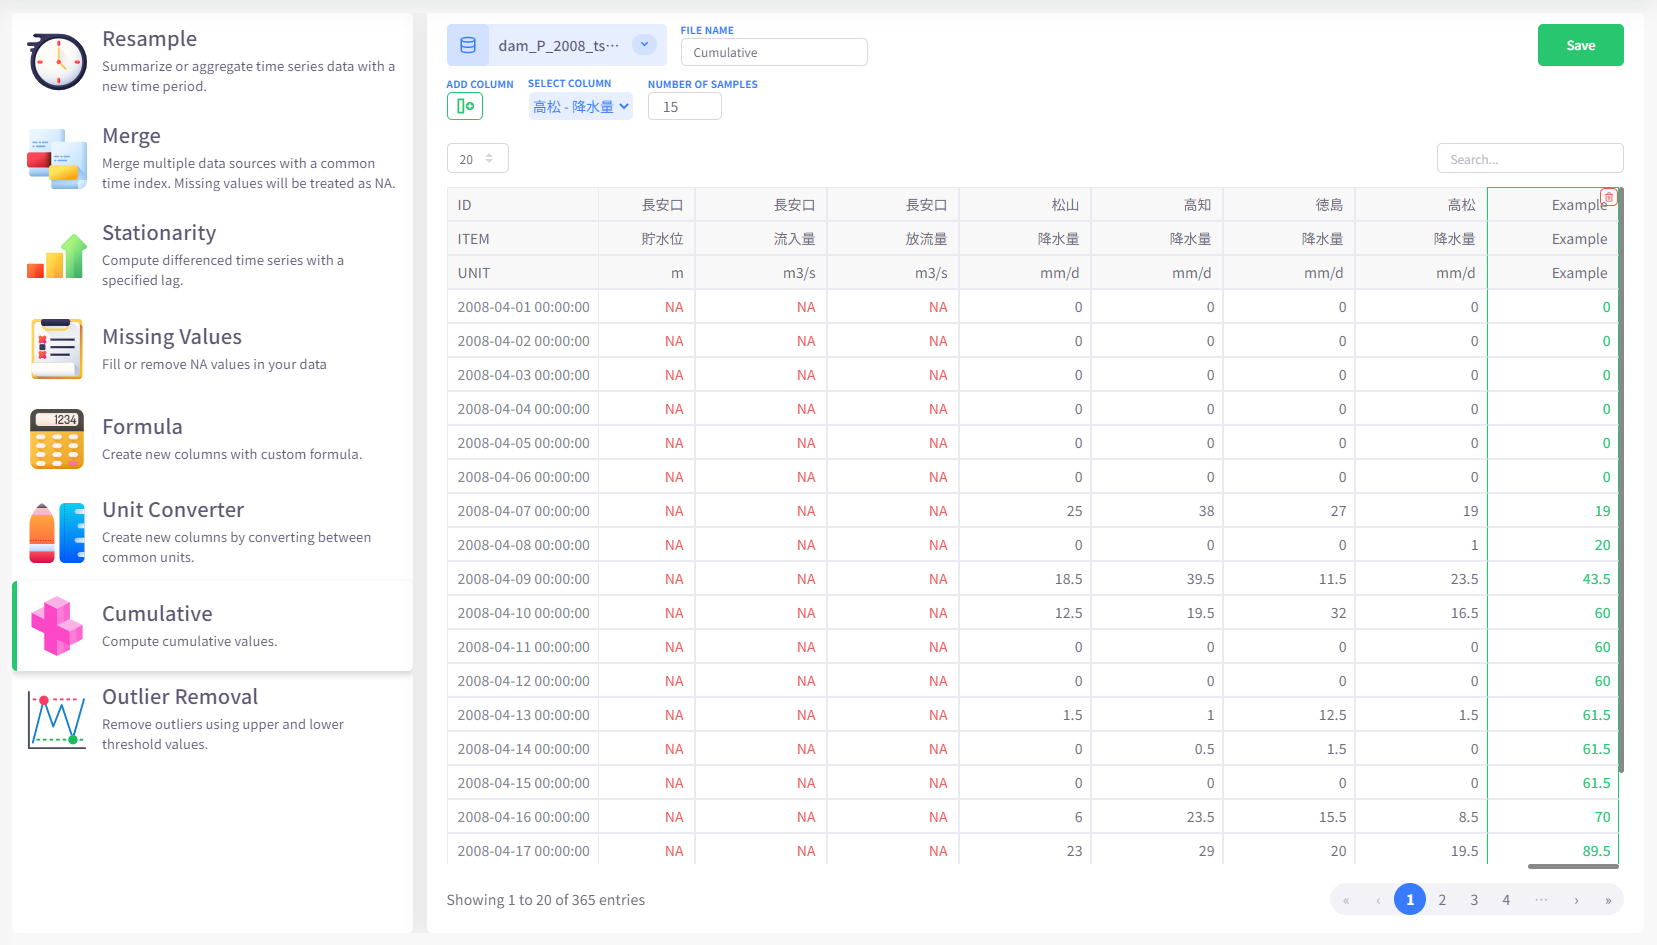
Cumulative
Cumulative is a tool for adding cumulative data to an existing datasource. Cumulative data are calculated by accumulating data entries of a column in the original datasource table.
Select data to calculate
Click the Datasource button on the upper left area of the screen and select the data to calculate.
Add blank column
Click the Add Column button on the upper left area of the screen to add a blank column to the end of the data table. Calculated data will be written into this column. You can add multiple columns at the same time.
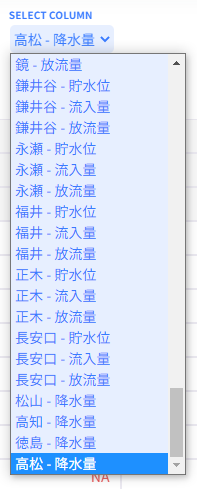
Select source column to calculate
On the upper left area of the screen, select a source column from the Select Column drop-down menu. Cumulative data will be calculated and written into the added column right after a source column is specified. If you have multiple blank columns added, you should specify the one for each calculating attempt.
Specify the number of samples
You can configure the number of samples will be used for calculating cumulative data by specifying any integer value in "Number of samples" settings. Leave the field blank or enter value "0" to reset this setting to default.
Outlier Removal
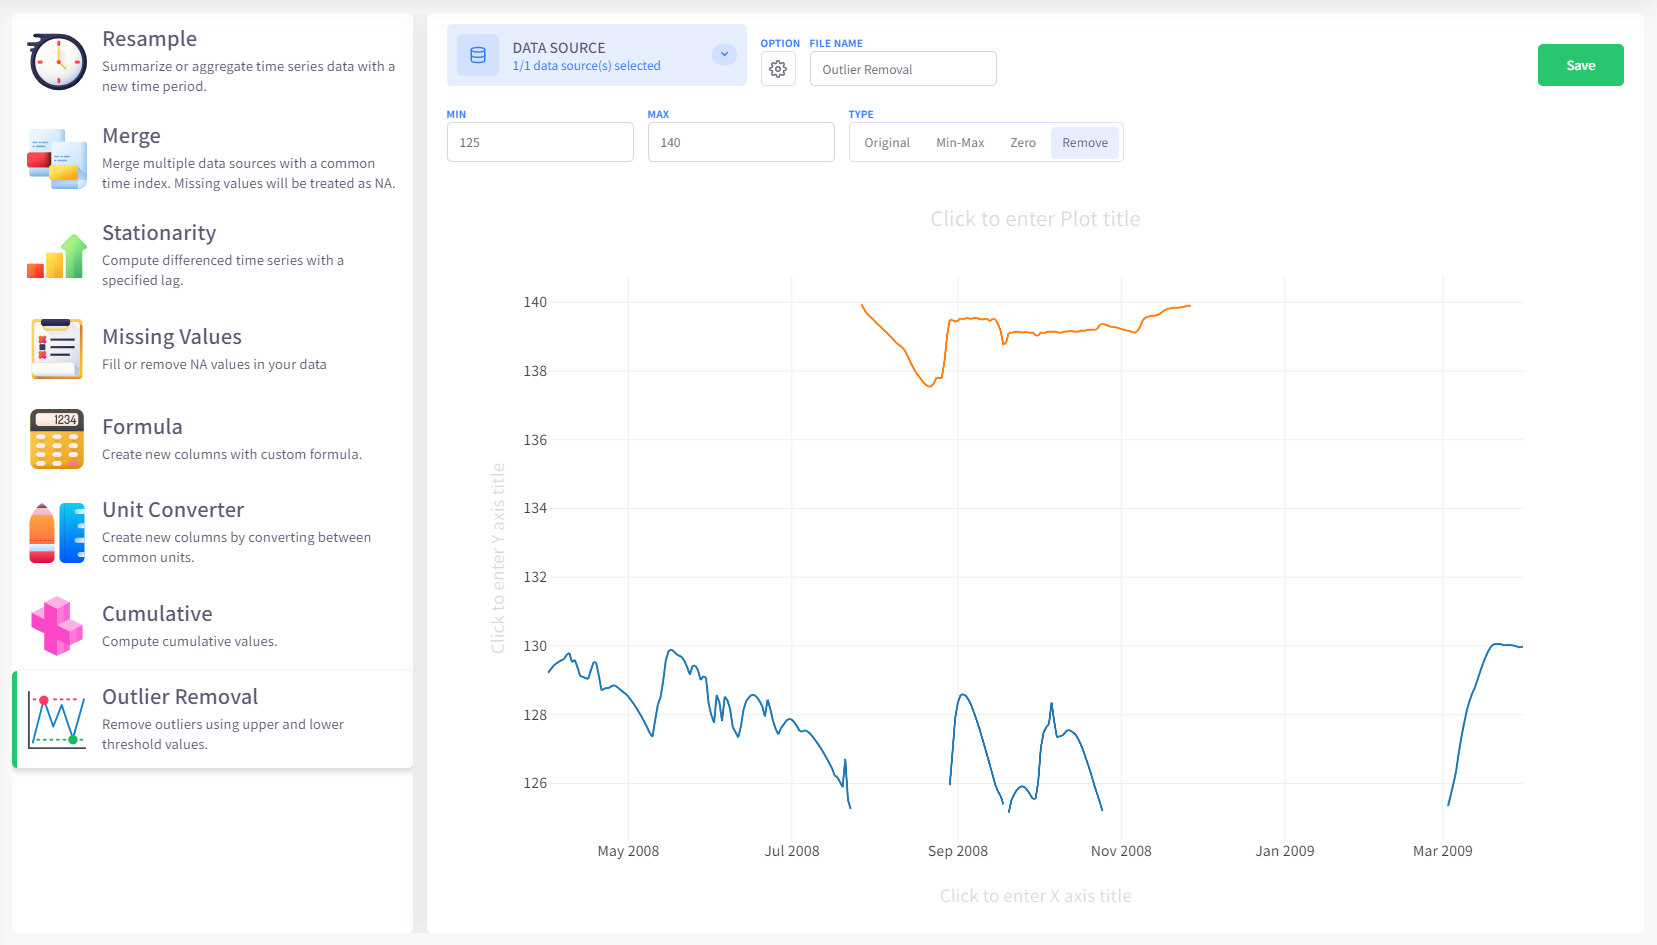
Outlier Removal offers a tool for handling data entries that fall outside of a specified data range.
Select data to process
Click the Datasource button on the upper left area of the screen and select the data to process.
Enter minimum and maximum values and select handling method
On the upper center area of the screen, specify your own data range by enter minimum and maximum values, which will be visualized on the preview plot with 2 straight dotted lines. After that, select a removal method to preview new data.
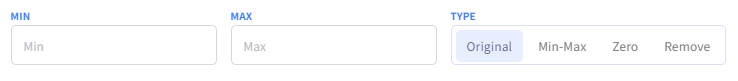
How different removal methods work is described below:
- Min-max: Based on the fact that outliers fall beyond the minimum or maximum value of the specified data range, they will be assigned the respective value.
- Zero: All outliers will be treated as 0.
- Remove: All outliers will be treated as NA.