Screen Overview
Main map screen
A screen that displays loaded measurement points and data on a map that serves as a background map
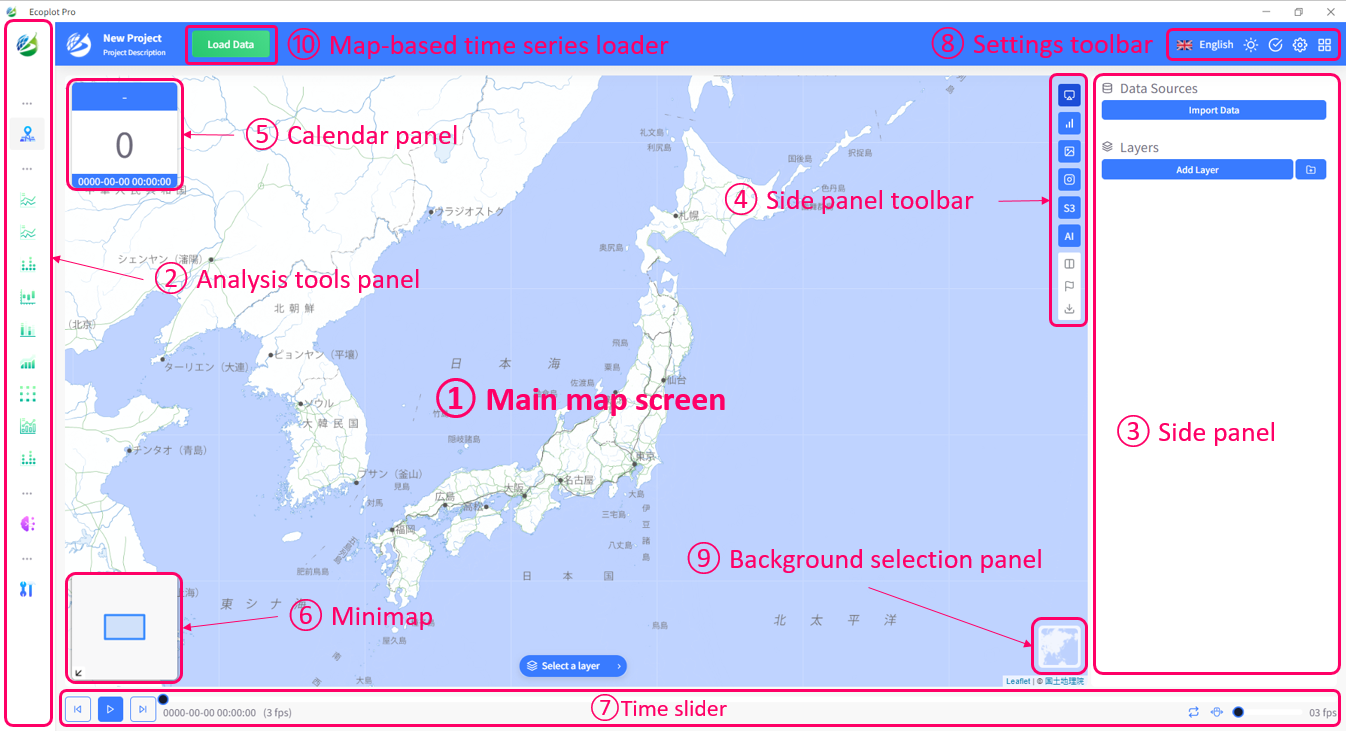
Analysis tools panel
A panel for selecting tools for analyzing individual time-series data and relationships between them.
The analysis tool panel is enlarged when the mouse cursor hovers over it.
There are multiple analysis tools that can be accessed from this panel, including: Time Series, Line Plot, Scatter Plot, Box Plot, Histogram, Decomposition, Correlation, and Seasonality Analysis.
Side panel
A panel for loading and viewing files
Side panel toolbar
A toolbar to toggle what is displayed in the side panel
Calendar panel
A panel that displays the date, time, and elapsed days in conjunction with the time slider
Minimap
A minimap that shows the extent displayed on the main map screen
Time slider
A time slider that animates the loaded time-series data over time
Settings toolbar
Main map screen toolbar for setting languages, app theme, etc.
Background selection panel
A panel for selecting background mode for the main map screen
Map-based time series loader
A tool for creating Ecoplot-friendly CSV datasources