Map
Open main map screen
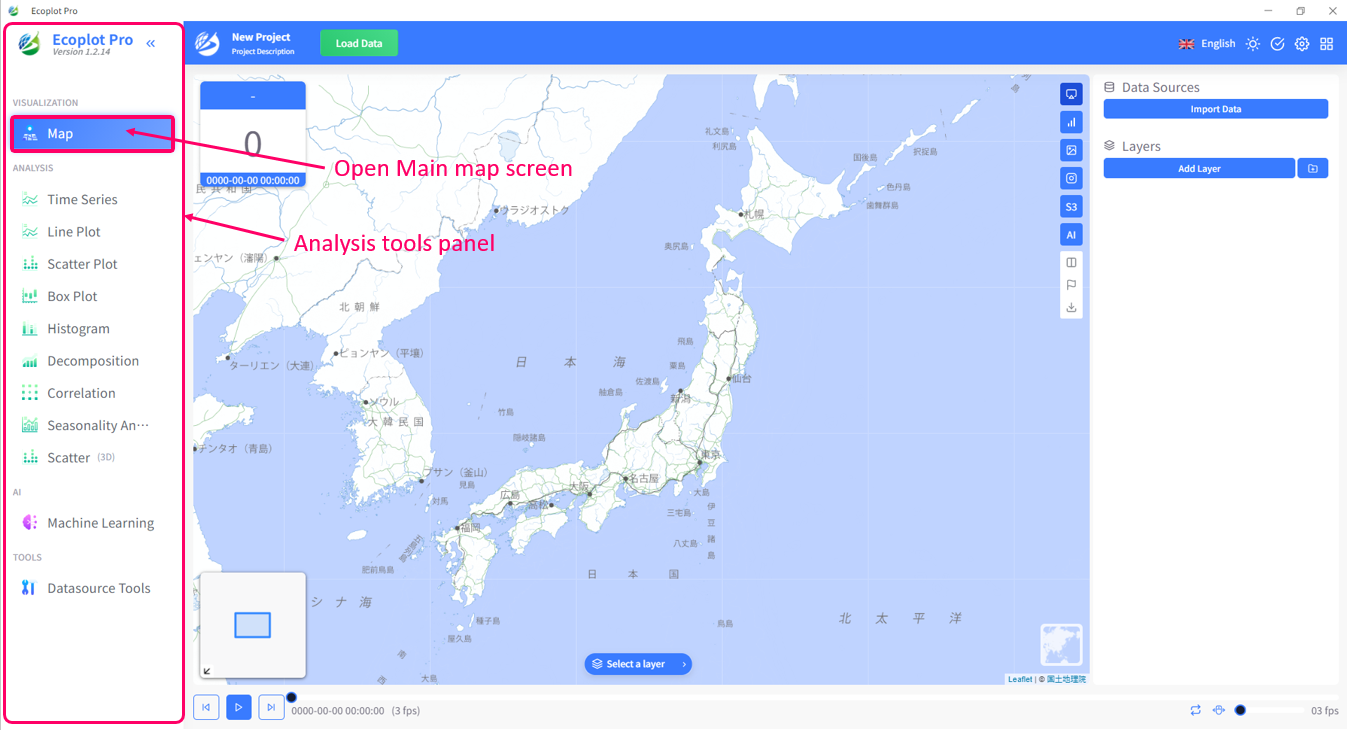
Select Map at the top of the analysis tools panel. Open it by hovering the mouse cursor over the analysis tools panel on the left side of the screen (mouse hover).
Import data
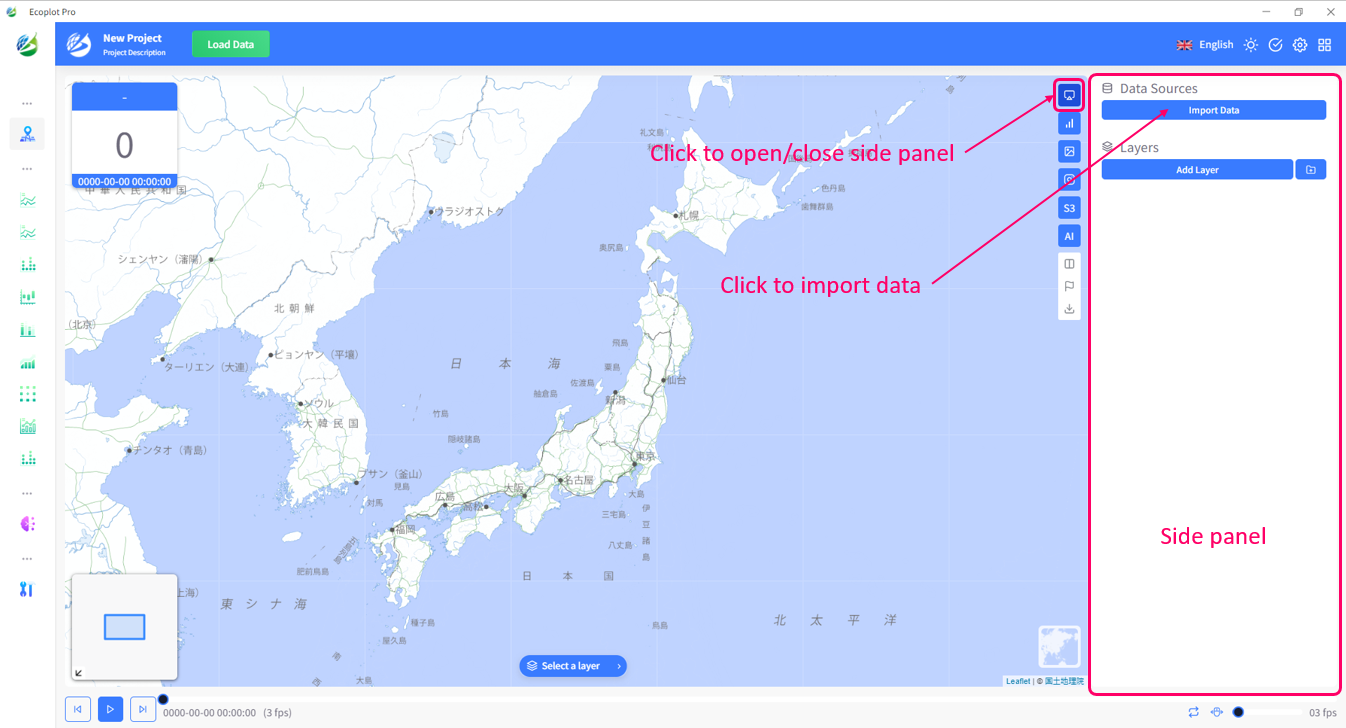
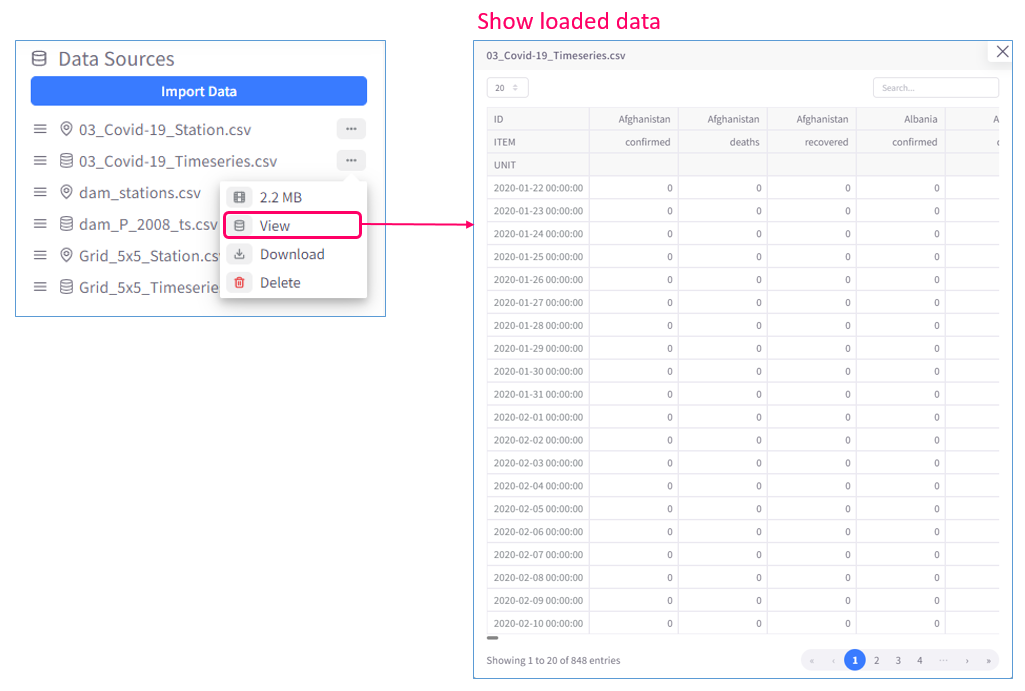
Click the Import Data button in the Data side panel and select file to import. This side panel opens and closes by clicking the Control button at the top of the side panel toolbar.
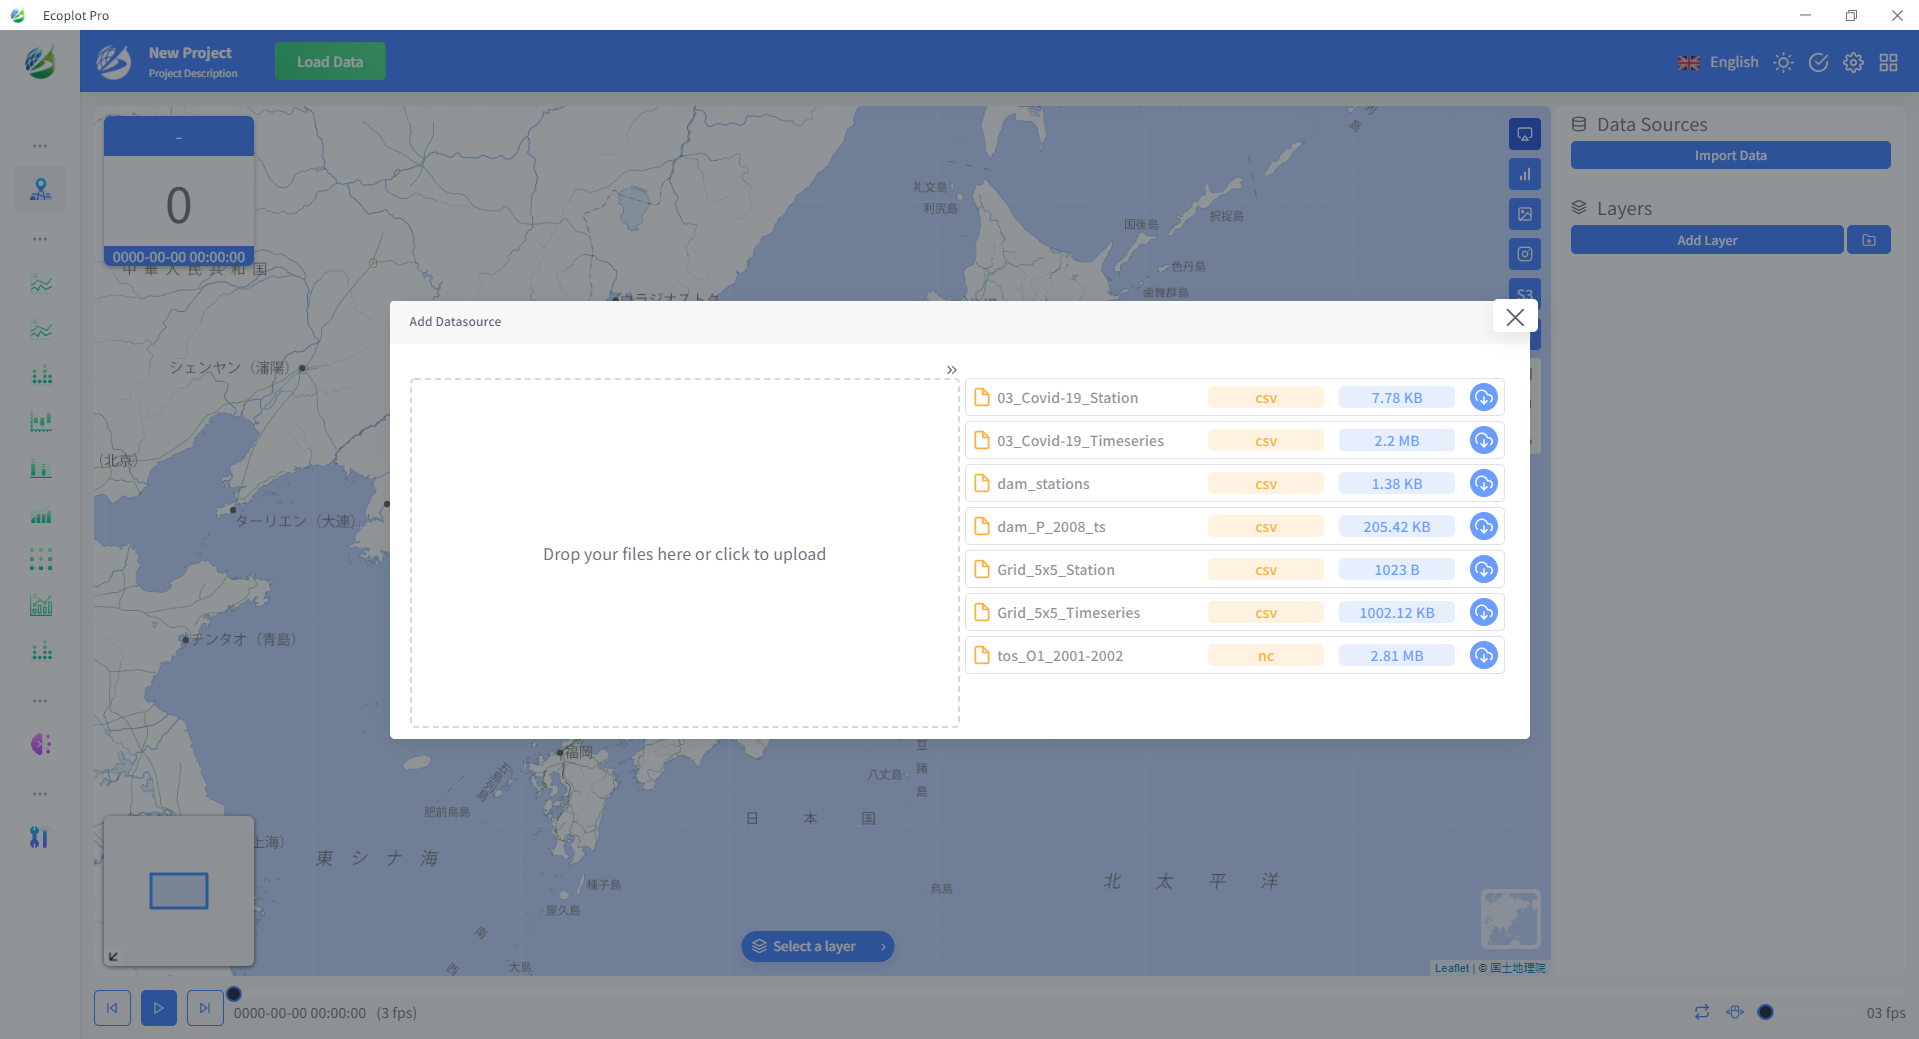
After selected data files are successfuly imported inco Ecoplot, you can open data table to check the imported data.
Create layer
To create a new layer, click the Add Layer button in the Data side panel. This will open the Add Layer menu.
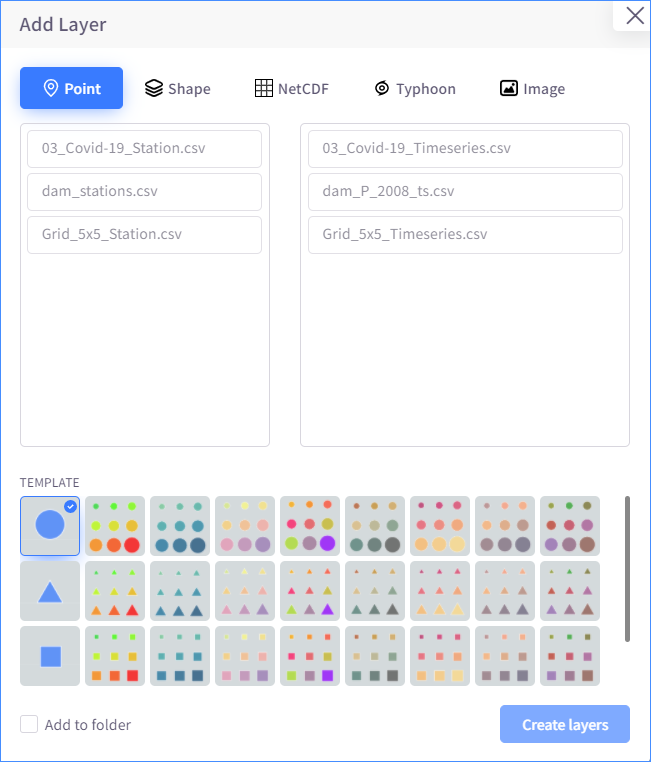
Select the layer type of the new layer, then select data files from the list of candidate files below. Also, select a color and shape prefix from the templates (if available for selected layer type). Finally, click the Create Layers button at the bottom right corner of the menu. If you want to add multiple layers as a group, check the option "Add to folder" before clicking Create Layers button, this way, the new layers will appear as a group.
Interact with layer
You can freely interact with layers through the Data side panel or the main map screen.
Manage layers in the Data side panel
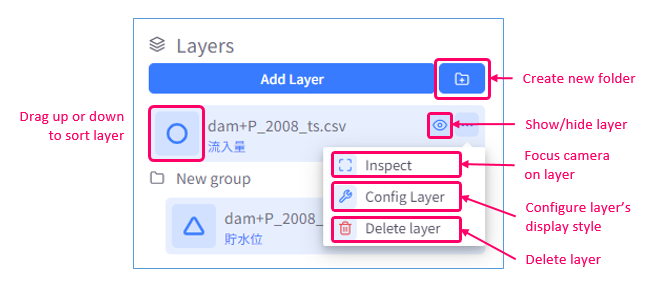
Managing layers through Data side panel involves: creating layer, configuring display style of layer, sorting layers, adjusting layer's visibility, focusing map camera on layer, and delete layer.
Interact with layer on Main map screen
You can also interact directly with layers on Main map screen by scaling map camera to adjust view of layer, or selecting active layer to view charts or image on side panel, or to select and group map objects.
Select active layer
The active layer is the layer that is displayed on the map in the main map screen, in the pop-up and in the side panel. Select "Select a layer" at the center bottom of the screen and specify one layer from the list.
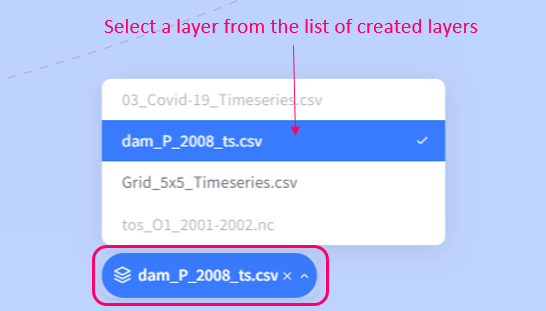
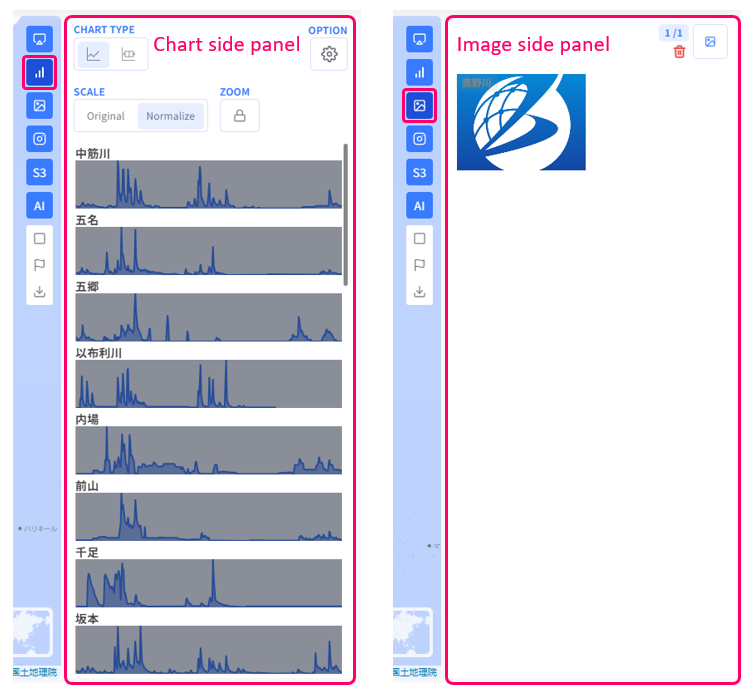
By selecting active layer, you can view time series or box plots of observation points of that layer on Chart side panel, or images that are added to that layer's pop-ups on Image side panel.
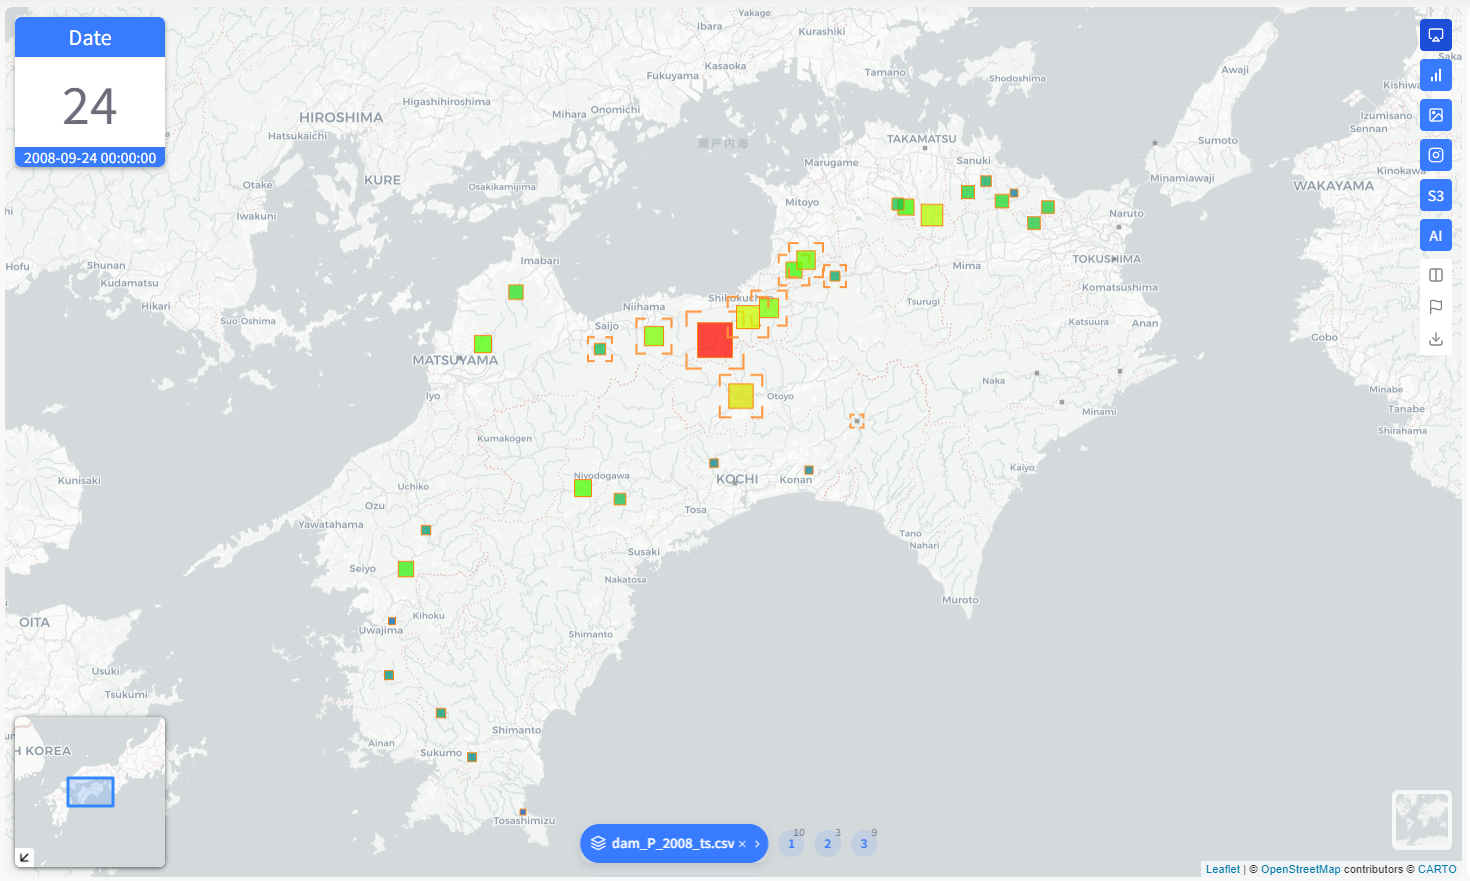
In addition, you can also select and group observation points of selected layer. To select observation points, hold the Shift key and use the mouse cursor to select points. To group selected points, press the Ctrl key and a number key from 0-9.
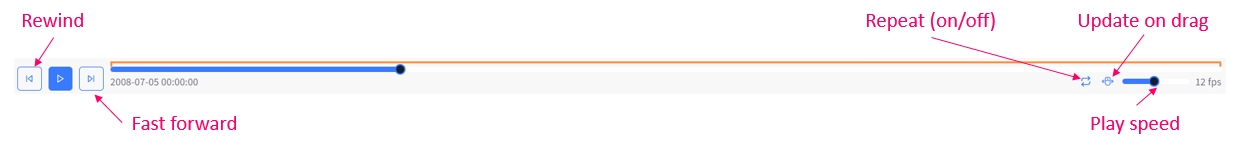
Time player
The time transition from the start date to the end date of a layer's time indexes is displayed as an animation.
Scene
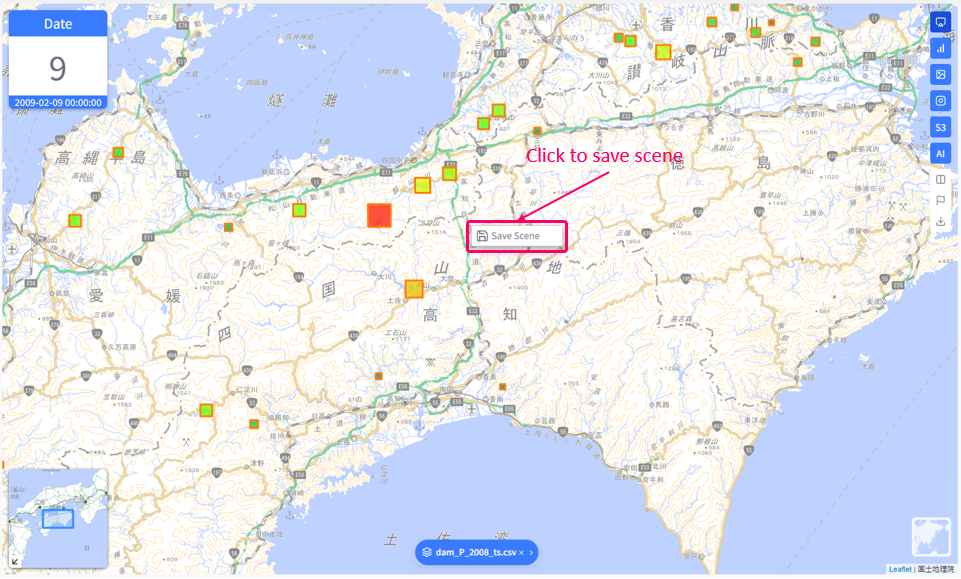
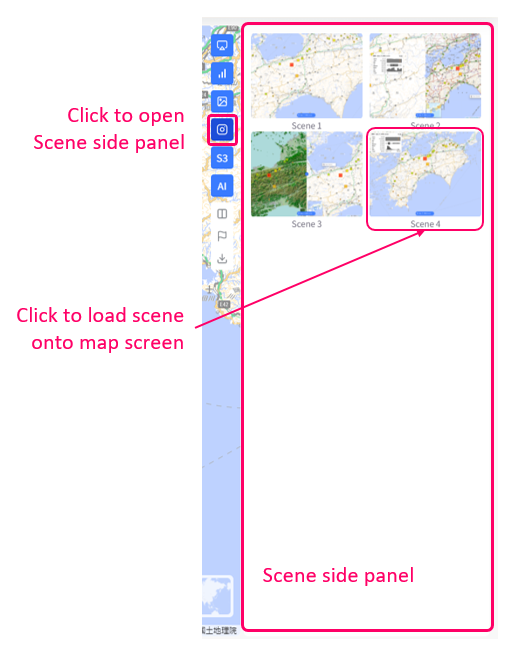
Scenes are captures of the map screen that are saved in and can be loaded from Scene side panel. By saving scenes, you can quickly switch between multiple map views. To save a scene, simply right click anywhere on the main map screen and select "Save Scene".
To load a saved scene, open Scene side panel and select the scene you want to load.
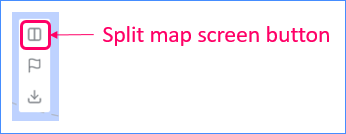
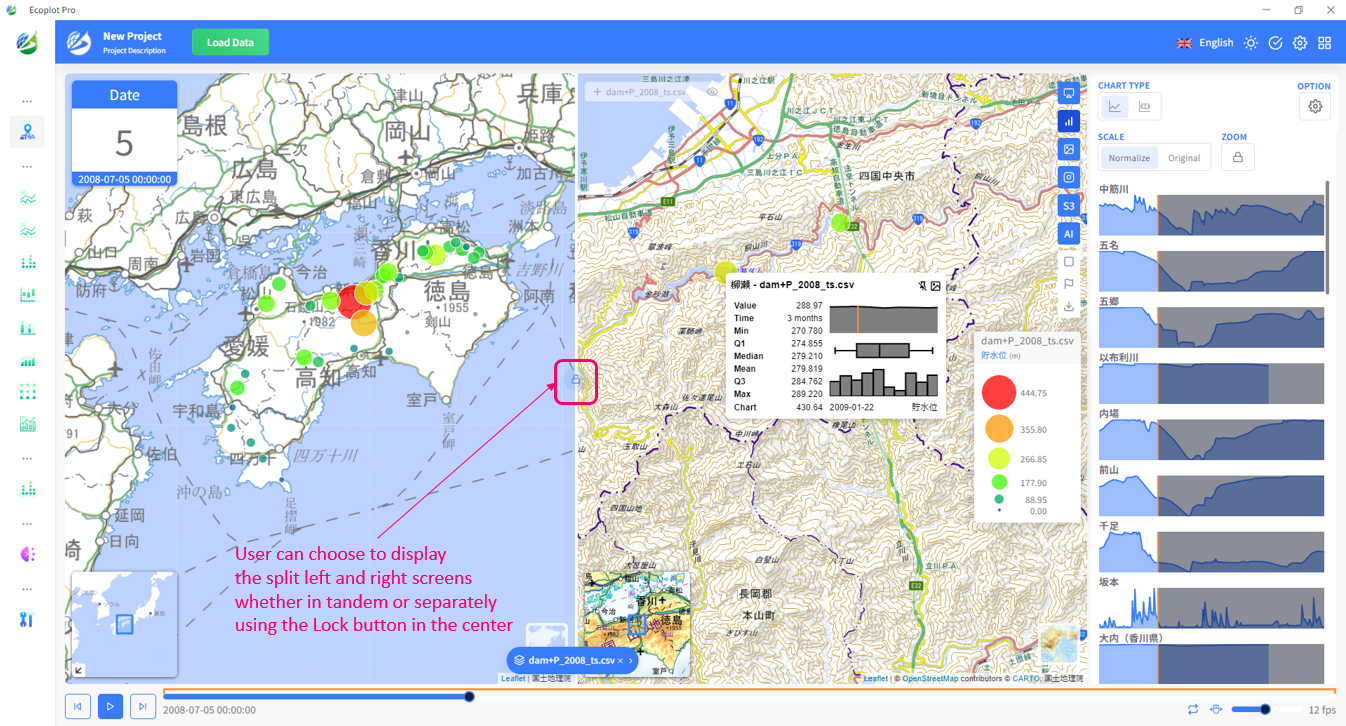
Split map screen
You can split the map screen into 2 smaller map screens. You can choose to display the split left and right screens whether in tandem or separately using the Lock button in the center.
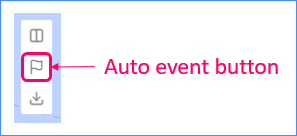
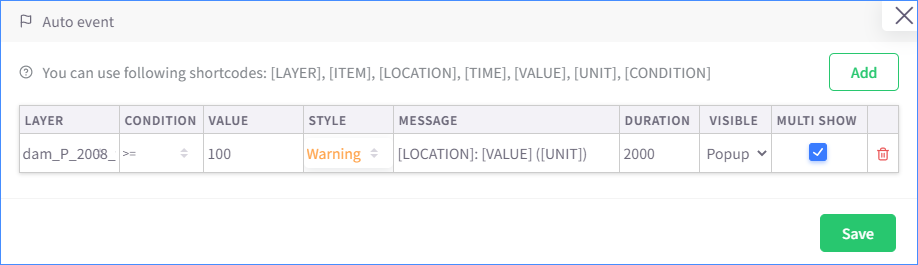
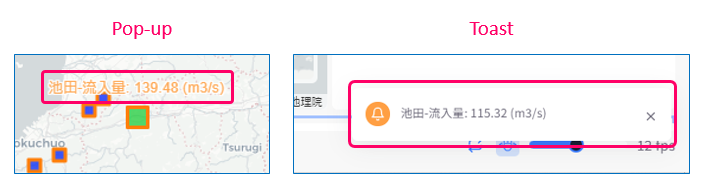
Auto event
Auto event is used to send notification to the screen when the data meet certain conditions.
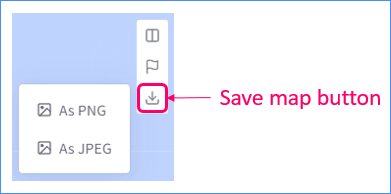
Save map
You can choose to save map screen as a PNG or JPEG image.
Metadata
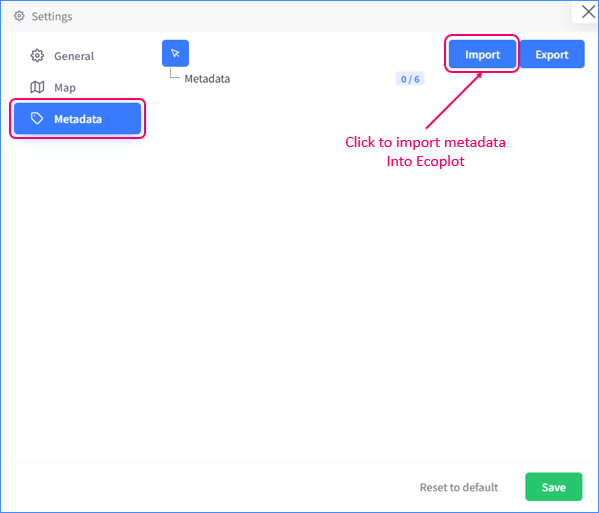
Import metadata
Metadata can be imported into Ecoplot through Settings.
View and edit metadata
Metadata value can only be edited through a pop-up that has image. To view and edit metadata, click the Expand Metadata button on the pop-up.
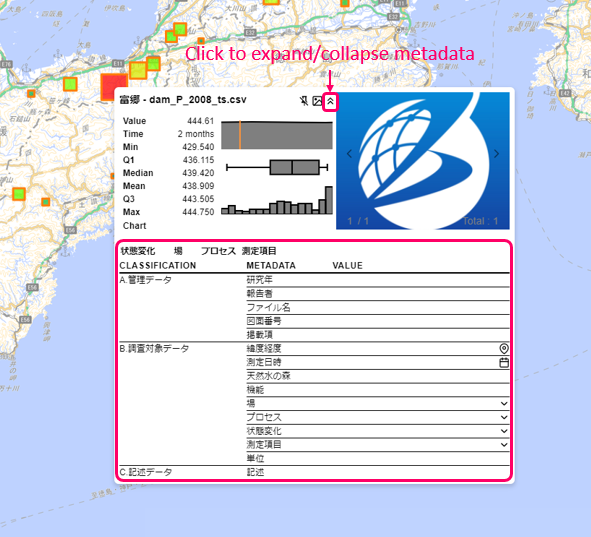
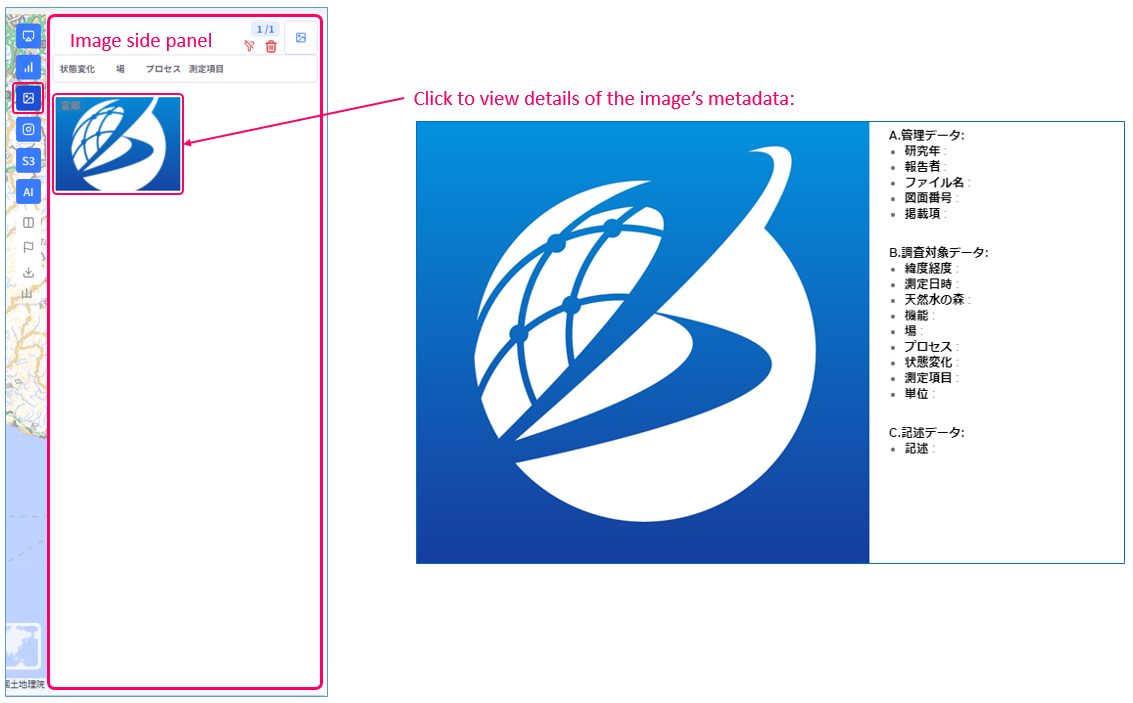
You can also view metadata value of an image through the Image side panel.