Introduction
Overview
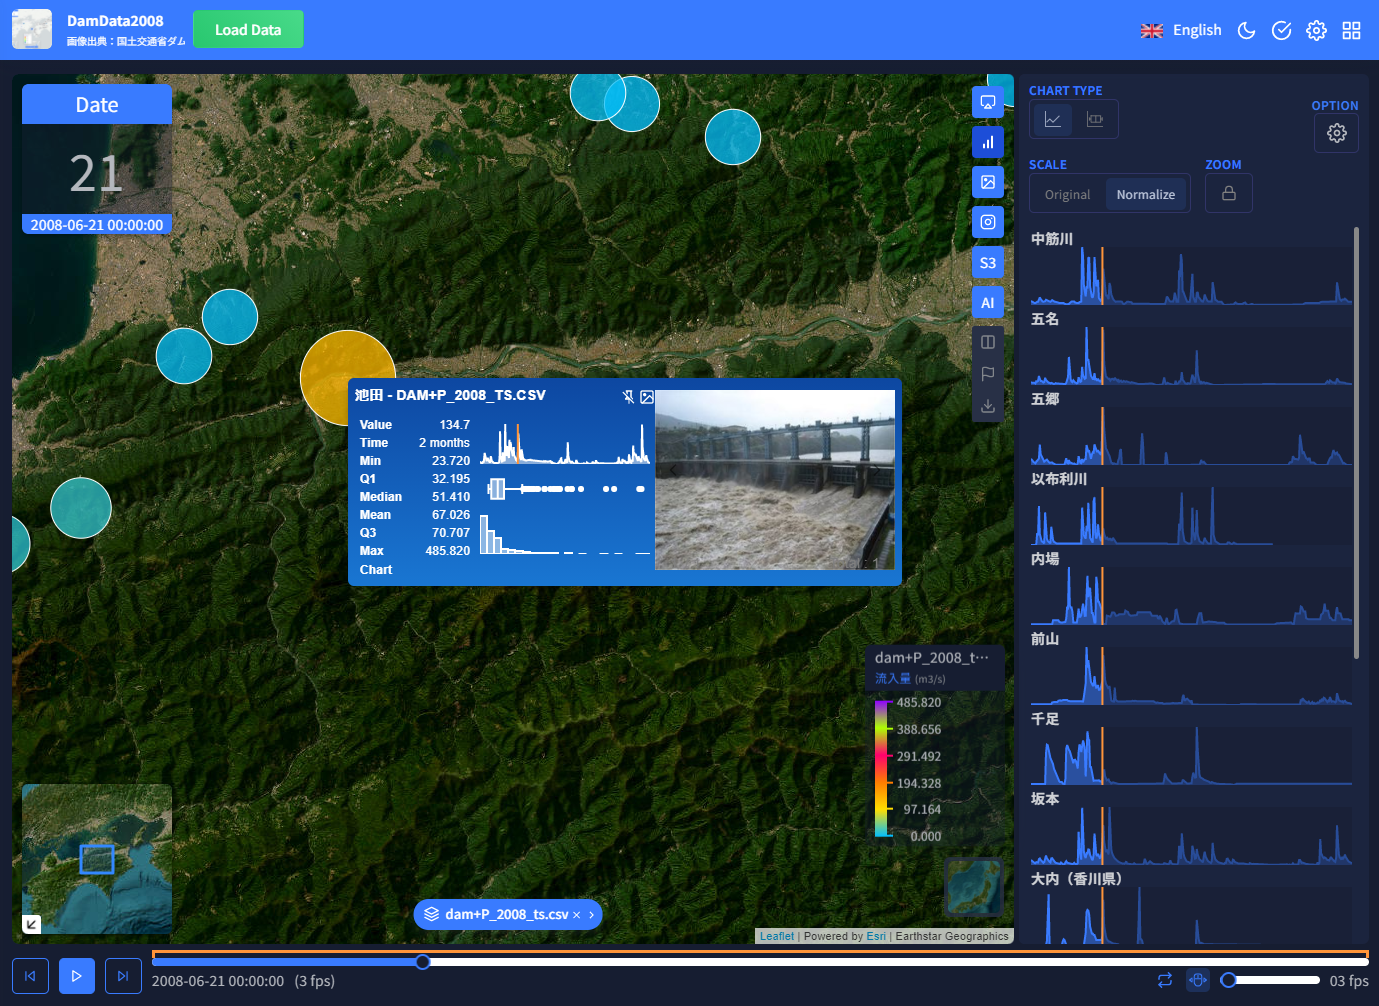
Ecoplot(R) is a time-series data analysis and visualization platform linked to maps. Key features include:
- By bi-directionally linking measurement points placed on the map with time-series data such as on-site measurement data, measurement data from many measurement points can be freely visualized with just a mouse operation.
- You can visually read the regional characteristics of the data by displaying an animation that show changes in the size and color of the measurement points displayed on the map according to the time transition of the time-series data.
- Graphs plotted by selecting measurement points can be manipulated freely with the mouse (interactive data visualization), enabling rapid review and detailed analysis of measurement data.
- It can be used as a simple database, a quick visualization and analysis tool that allows the project team to share and view the measurement data that is acquired periodically.
Quick Start
In Ecoplot, you can visualize data by loading the following two types of CSV files:
Station Data
Station data is a CSV file that contains location information and attribute information for each station.
Required columns:
- ID: A unique identifier for each station
- LONGITUDE: Longitude (decimal degrees or degrees-minutes-seconds format)
- LATITUDE: Latitude (decimal degrees or degrees-minutes-seconds format)
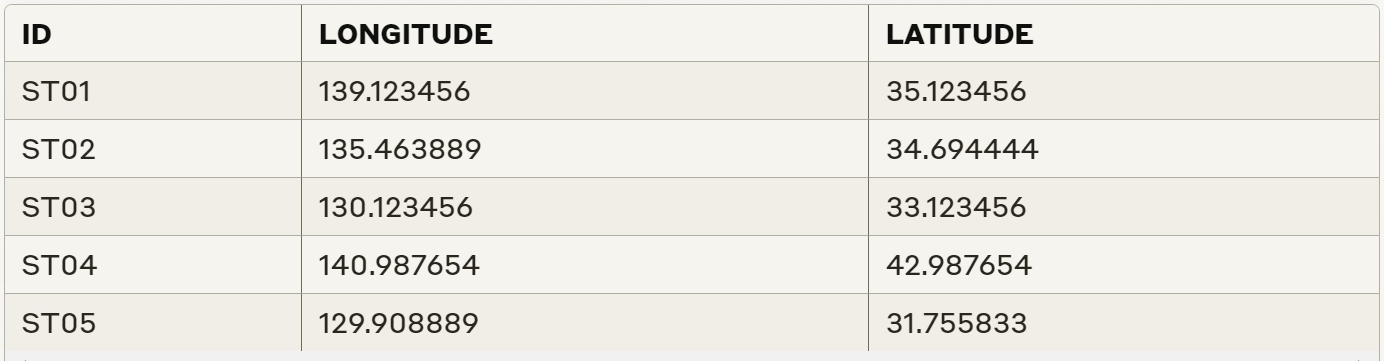
ID,LONGITUDE,LATITUDE
ST01,139.123456,35.123456
ST02,135.463889,34.694444
ST03,130.123456,33.123456
ST04,140.987654,42.987654
ST05,129.908889,31.755833
Time Series Data
Time series data is a CSV file that contains time-varying measurement data for each station.
Required columns:
- DateTime column: A column representing the date and time for each row
- Measurement value columns: Columns containing the measurement values for each station and item
Headers for measurement value columns:
- ID: A unique identifier for each station (Row 1)
- ITEM: The name of the measurement item (Row 2)
- UNIT: The unit of the measurement item (Row 3)
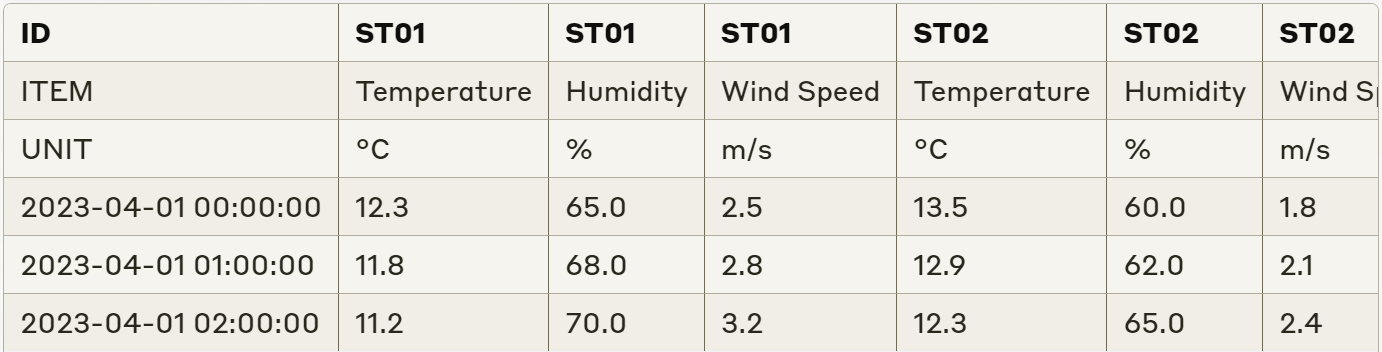
ID,ST01,ST01,ST01,ST02,ST02,ST02
ITEM,Temperature,Humidity,Wind Speed,Temperature,Humidity,Wind Speed
UNIT,°C,%,m/s,°C,%,m/s
2023-04-01 00:00:00,12.3,65.0,2.5,13.5,60.0,1.8
2023-04-01 01:00:00,11.8,68.0,2.8,12.9,62.0,2.1
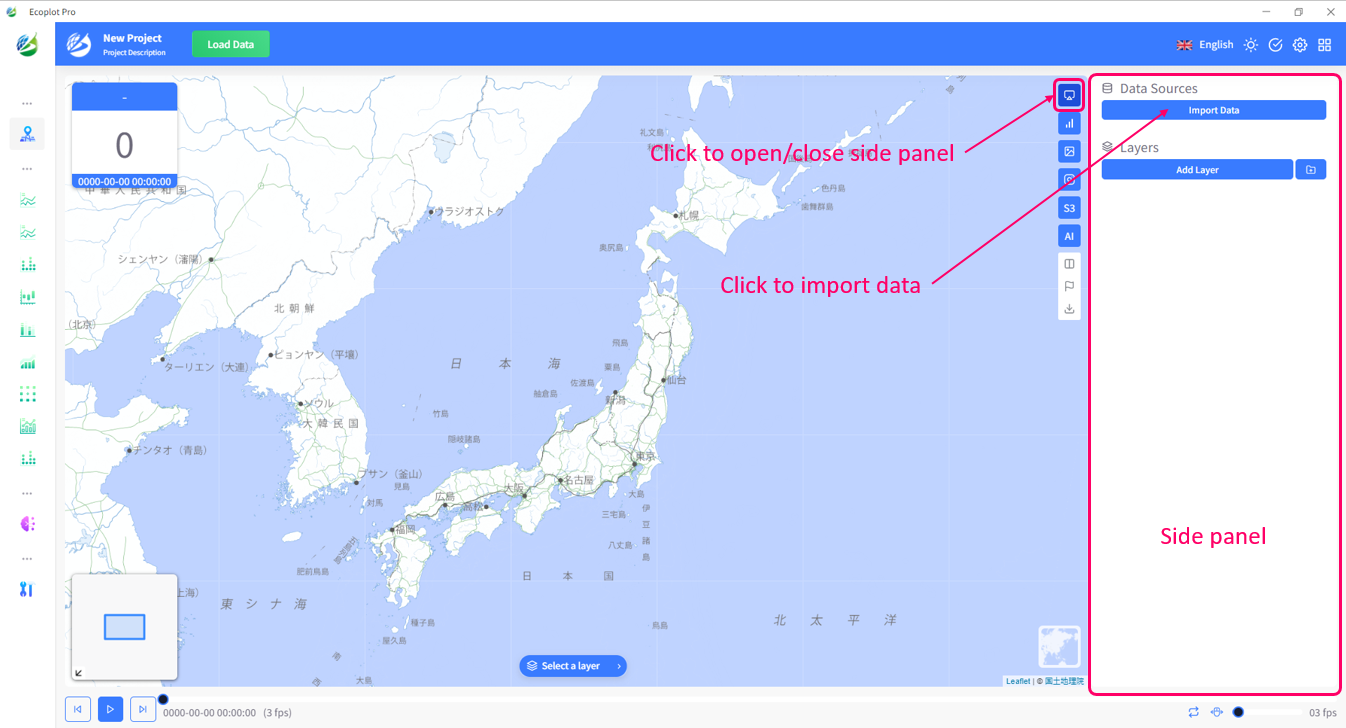
2023-04-01 02:00:00,11.2,70.0,3.2,12.3,65.0,2.4Click the Import Data button in the Data side panel and select file to import. This side panel opens and closes by clicking the Control button at the top of the side panel toolbar.
Terminology
The following is a list of keywords, links to Wikipedia, and references for basic terms.
- CSV format: https://en.wikipedia.org/wiki/Comma-separated_values
- GeoJSON format: https://en.wikipedia.org/wiki/GeoJSON
- NetCDF format: https://en.wikipedia.org/wiki/NetCDF
- Time series: https://en.wikipedia.org/wiki/Time_series
- Box plot: https://en.wikipedia.org/wiki/Box_plot
- Histogram: https://en.wikipedia.org/wiki/Histogram
- Decomposition: timeseriesdecomposition.html
- Correlation: https://en.wikipedia.org/wiki/Correlation_coefficient
- Machine learning: https://en.wikipedia.org/wiki/Machine_learning
Browser
The following are recommended browsers for optimal performance.

Google Chrome
Google builds powerful tools for connecting, playing, working and getting things done. All of these tools work in Chrome.

Microsoft Edge
Microsoft Edge is a fast and secure browser that helps protect your data and save your time and money.
Requirement
The following are minimum and recommended computer requirements.
| Minimum requirements | |
|---|---|
| Operating system | Windows |
| CPU | 2 cores |
| Memory | 4GB RAM |
| Disk capacity | 80GB SSD |
| Graphics hardware | Not required |
| Sound hardware | Not required |
| Recommended conditions | |
|---|---|
| Operating system | Windows |
| CPU | 4 cores |
| Memory | 8GB RAM |
| Disk capacity | 160GB SSD |
| Graphics hardware | Not required |
| Sound hardware | Not required |