Decomposition
Overview
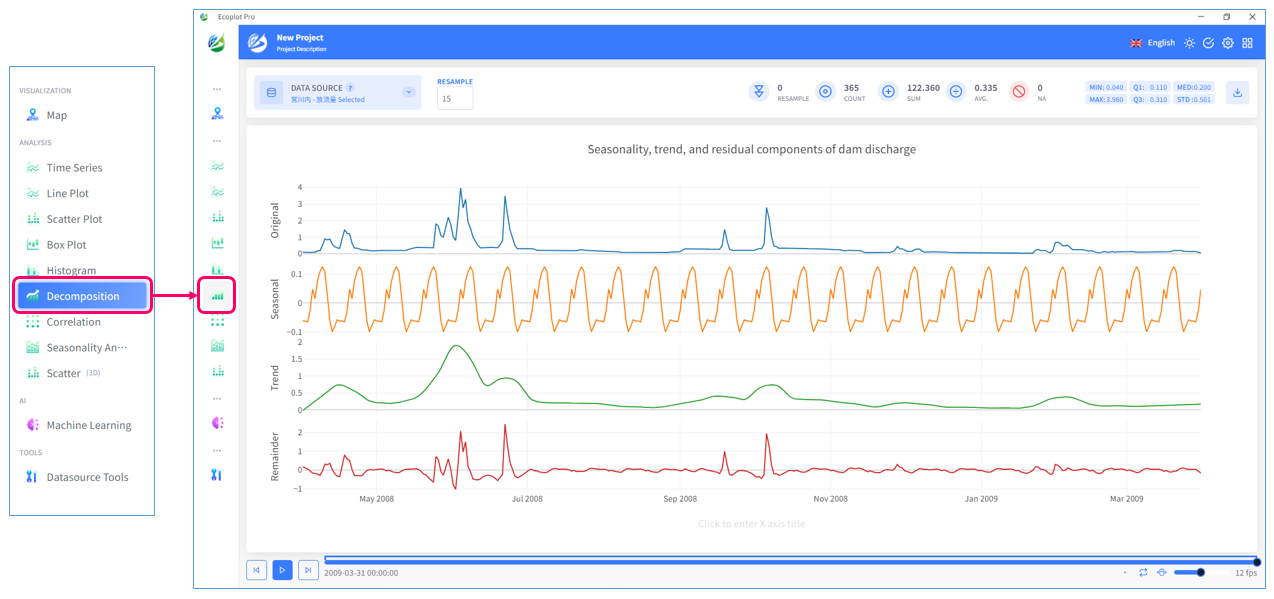
STL (Seasonal and Trend decomposition using Loess) is one of the component decomposition methods for time-series data. STL is used to decompose components such as seasonality, trends and residuals in data. The STL procedure is described below:
- Estimate seasonality: First, the seasonal component of the data is estimated. Local regression (Loess) is used to smooth seasonal patterns in the data. The seasonal component represents repeating patterns or periodic variations in the data.
- Estimate trend component: Next, the trend component that represents the long-term changes in the data is estimated. Local regression is used to extract smooth trends in the data. The trend component shows the long-term upward or downward trend of the data.
- Estimate residuals: Finally, the residual component is estimated. Residuals are remains of the original data after removing the seasonal and trend components. The residual component contains random fluctuations that are not included in seasonal patterns or trends.
- STL can be used to remove seasonal variations and trends in time-series data and isolate residual components. This makes it easier to analyze seasonal patterns and long-term changes in the data. STL is widely used to analyze various time-series data, such as data with strong seasonality or data with changing trends.
1
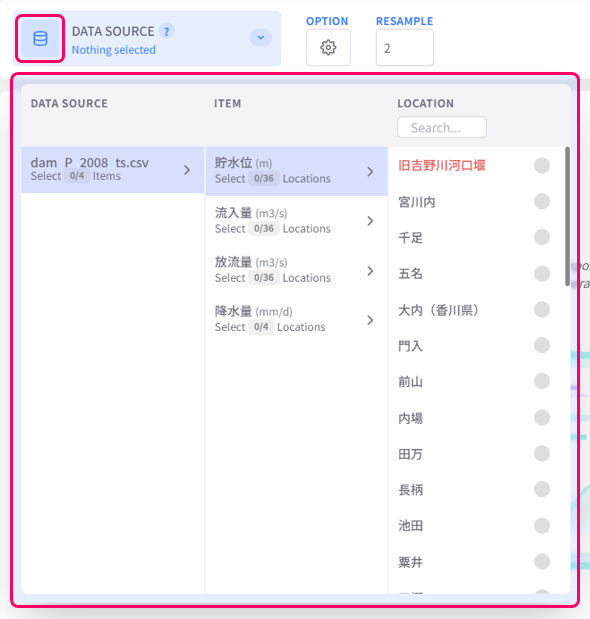
Select data to analyze
Click the Datasource button on the upper left corner of the screen and select the data to analyze.
2
Change resample level
For resample, specify a positive integer for the number of data points to extract the seasonal component.

3
Change display style
Click the Option button on the upper left corner of the screen to open the display style settings menu.
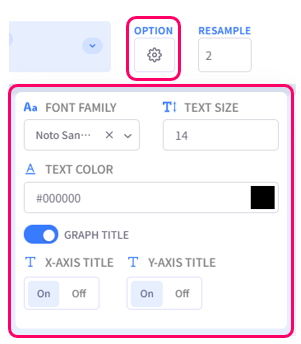
- Text Settings (Font family, Text size, Text color): configure the style of text for chart titles, legend items, axis labels
- Graph Title: click on this option to toggle the graph title ON/OFF. Show Title X: select the ON/OFF button to show/hide the title on the X-axis. Show Title Y: select the ON/OFF button to show/hide the title on the Y-axis