Seasonality Analysis
Overview
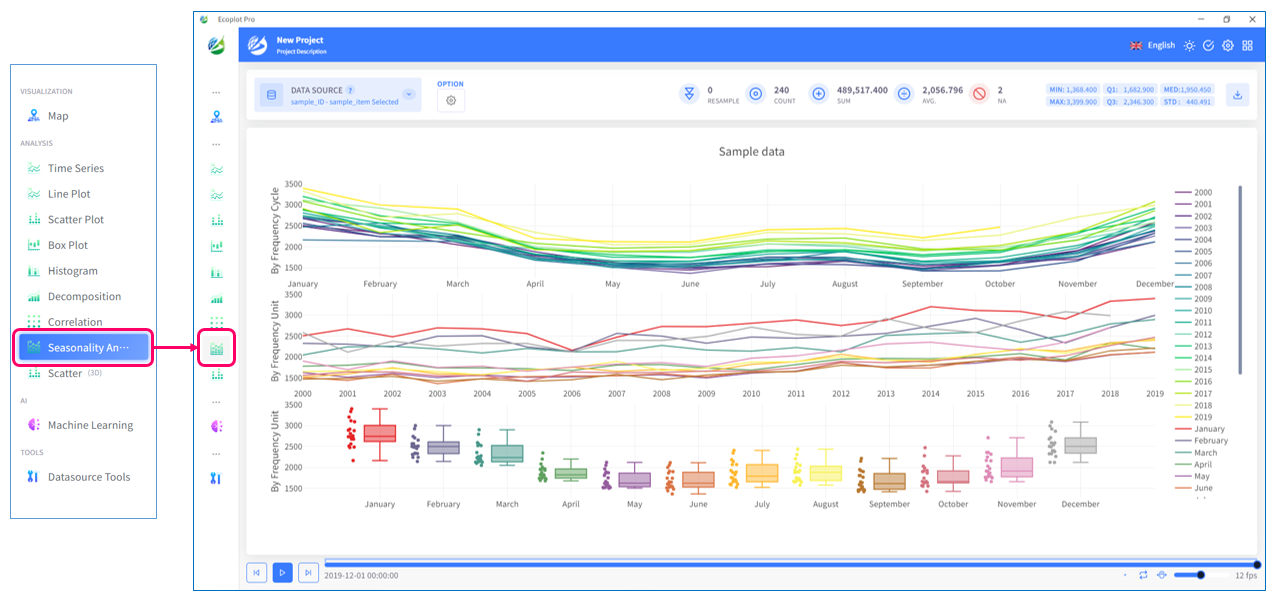
The [Seasonality Analysis] tab provides functionality to visually analyze the seasonality of time series data. In this tab, the time series data is divided into periods (cycles) and period units (months), and represented using line graphs and box plots. This allows for an intuitive understanding of how data fluctuations tend to vary by season.
Additionally, the [Seasonality Analysis] tab can display data for multiple years simultaneously, enabling the exploration of year-over-year changes in seasonal patterns and their relationship with trends.
By leveraging this seasonality analysis feature, you can discover periodic patterns hidden in time series data and understand how those patterns change over time. This information can be valuable for business planning, resource allocation, anomaly detection, and more.
Select data to display
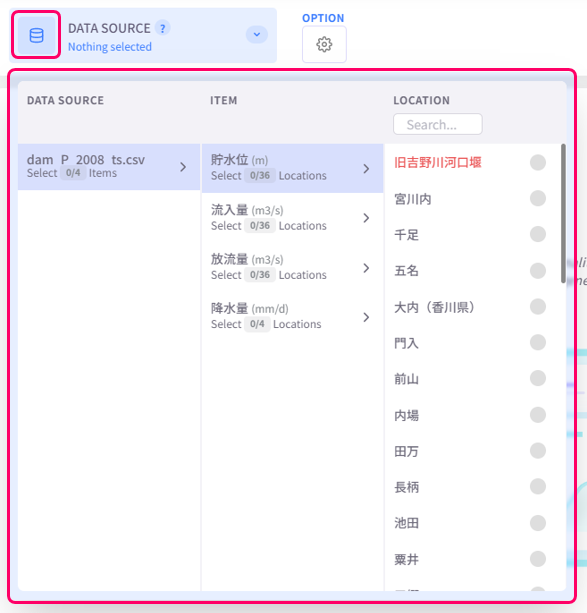
Click the Datasource button on the upper left corner of the screen and select data to be plotted.
Change display style
Click the Option button on the upper left corner of the screen to open the display style settings menu.
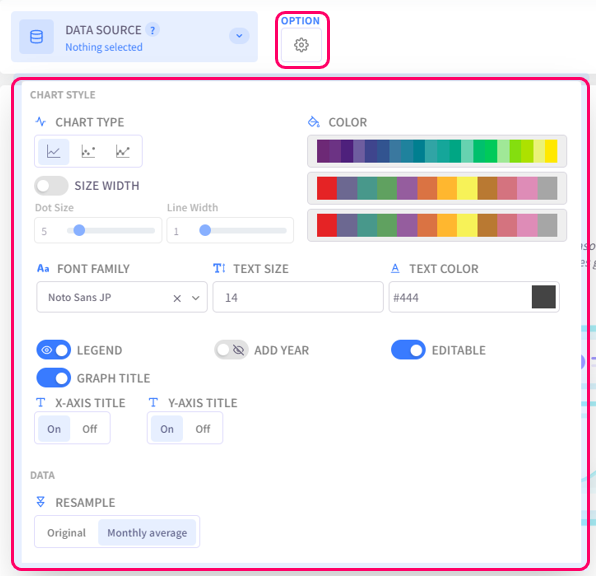
- Chart Type: select the chart type for plotted data
- Size Width: configure the dot size and line width of the chart
- Color: select the color palette for the chart
- Text Settings (Font family, Text size, Text color): configure the style of text for chart titles, legend items, axis labels
- Legend: click on this option to toggle graph legend ON or OFF. To edit the legend, click on the graph legends located on the right side of the screen. The eco/zip file can be saved with the updated legend
- Add Year: display the relevant year of the displayed data in the background of the chart
- Editable: turn on this option to allow changing title of the plot and the axes
- Graph Title: click on this option to toggle the graph title ON/OFF. Show Title X: select the ON/OFF button to show/hide the title on the X-axis. Show Title Y: select the ON/OFF button to show/hide the title on the Y-axis
- Resample: configure resample level of displayed data