Map-based Time Series Loader
Overview
Map-based Time Series Loader (MBTSL) is a feature that supports in-app creation of customized Ecoplot-friendly datasources. With MBTSL, users can easily create their own CSV location datasource by marking desired locations on the map screen, and add time-series data to those locations to create time-series datasource.
The use flow of MBTSL consists of 3 steps:
- Step 1: Create location data
- Step 2: Import time-series data
- Step 3: Create layer
Create location data
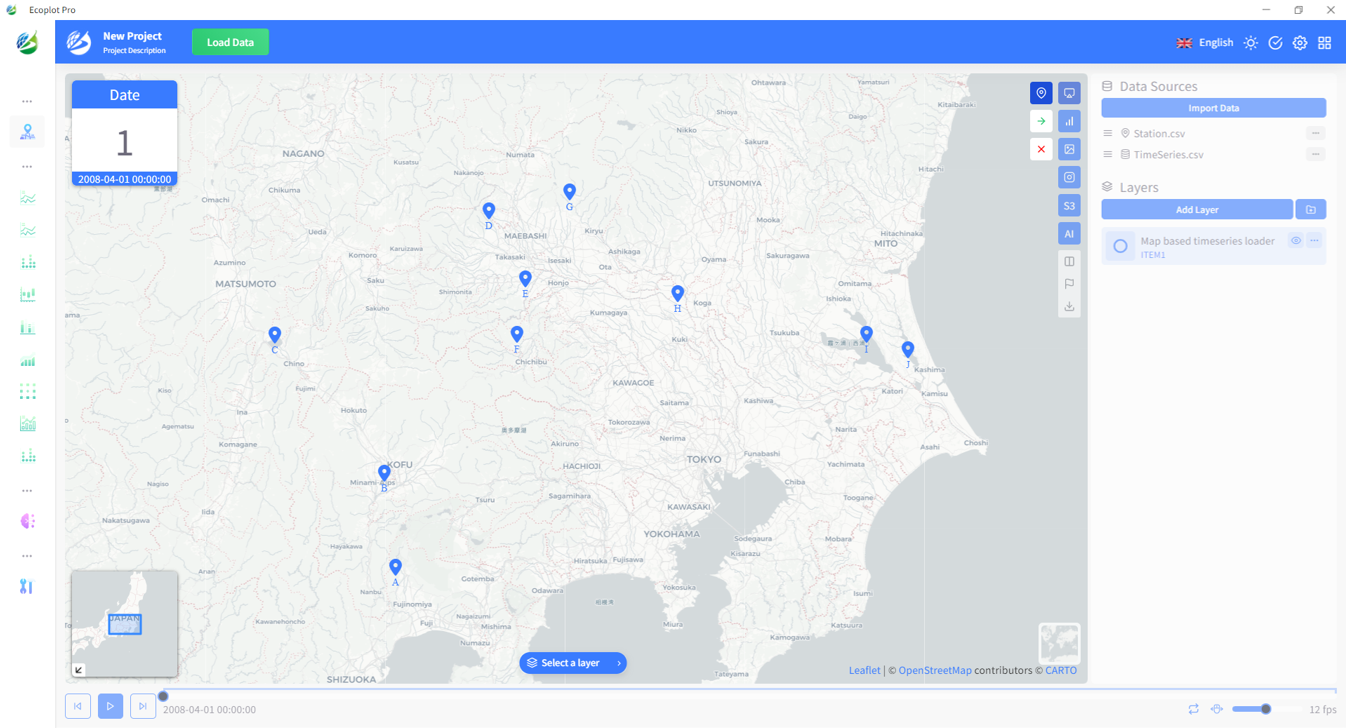
To open Map-based Time Series Loader, click the Load Data button on the top of the screen.

In MBTSL mode, click the Location button on the right side of the map screen to start creating location data.
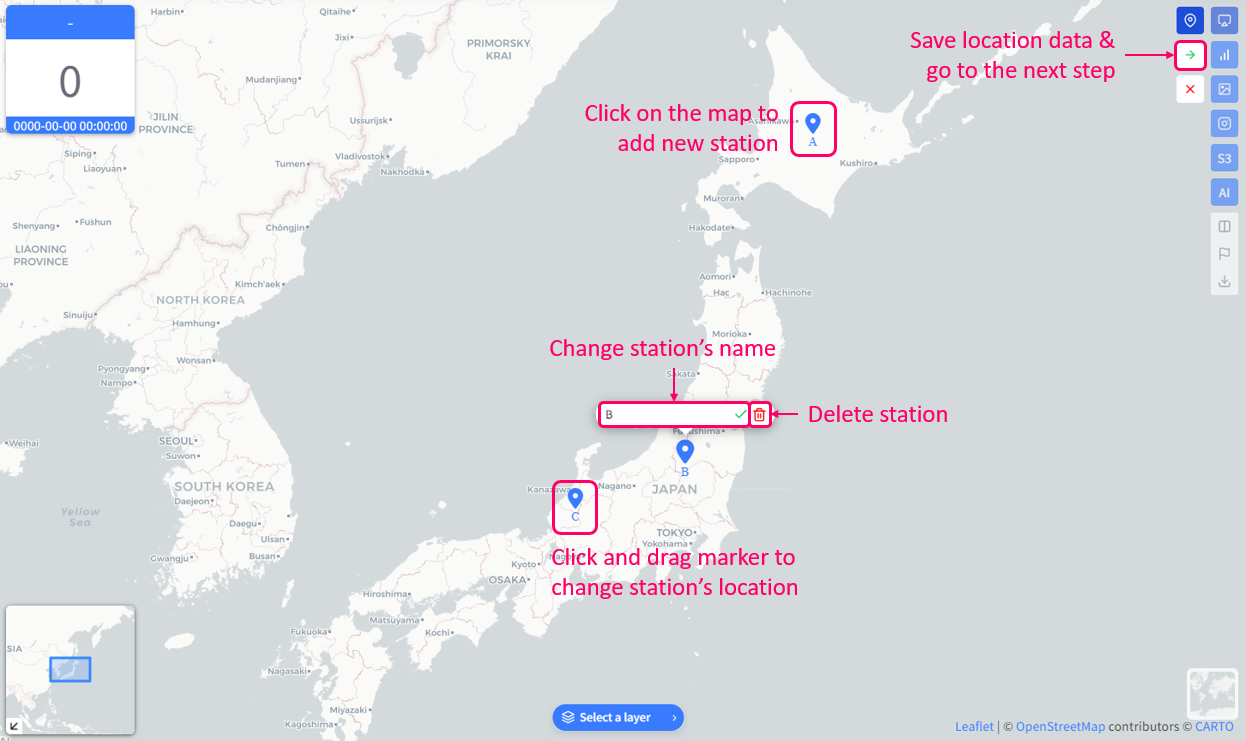
- Add new station: click anywhere on the map (a blue marker will appear where clicked to mark the station)
- Change station name: click the marker or its name, the station name box will appear. Enter the new name and click Rename location button to save. The station name must be unique among all stations. By default, stations are automatically named on creation.
- Change added station's location: click the marker and drag it to desired location
- Delete station: click the marker, then click the delete button
- Save progress: click Save to save location data and go to the next step.
Import time-series data
After location data is ready (at least 1 station is created), you can proceed to step 2 - Import data by clicking the Save button below the Location button. This is when the Time Series Files Import menu shows up.
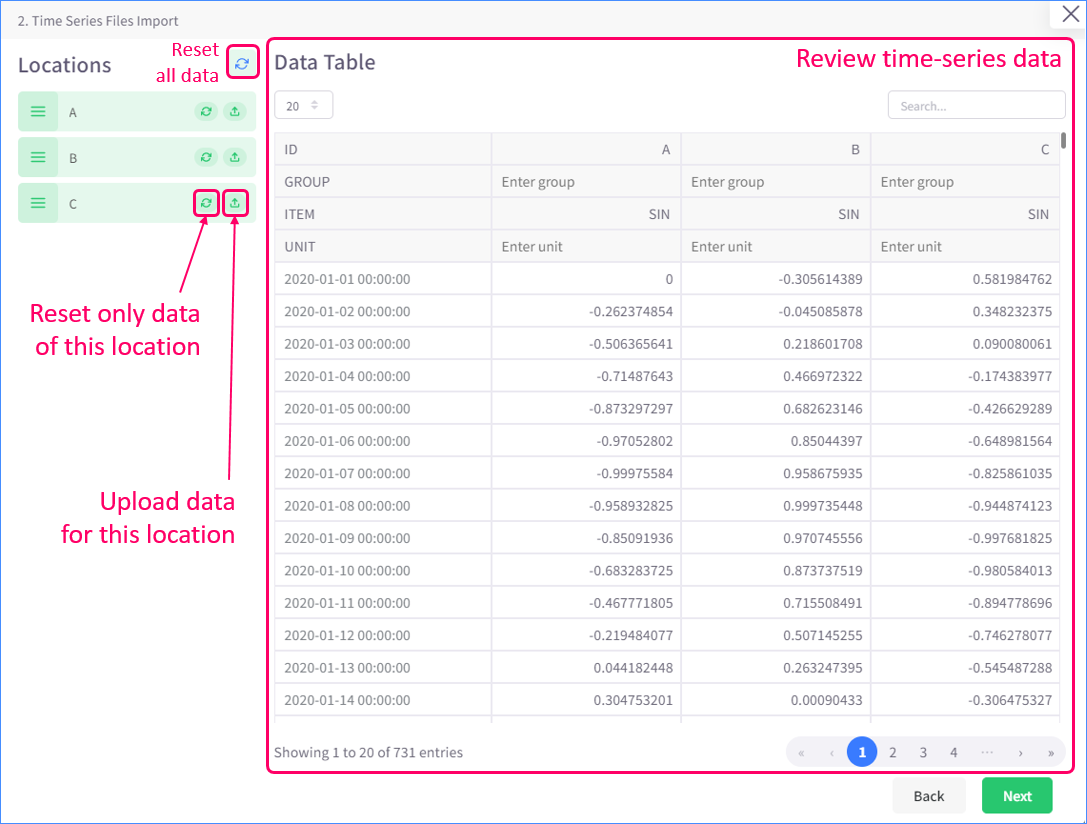
Click the Upload button to the right of a station to import data for that location. The "Upload data" menu for selected station will appear as below.
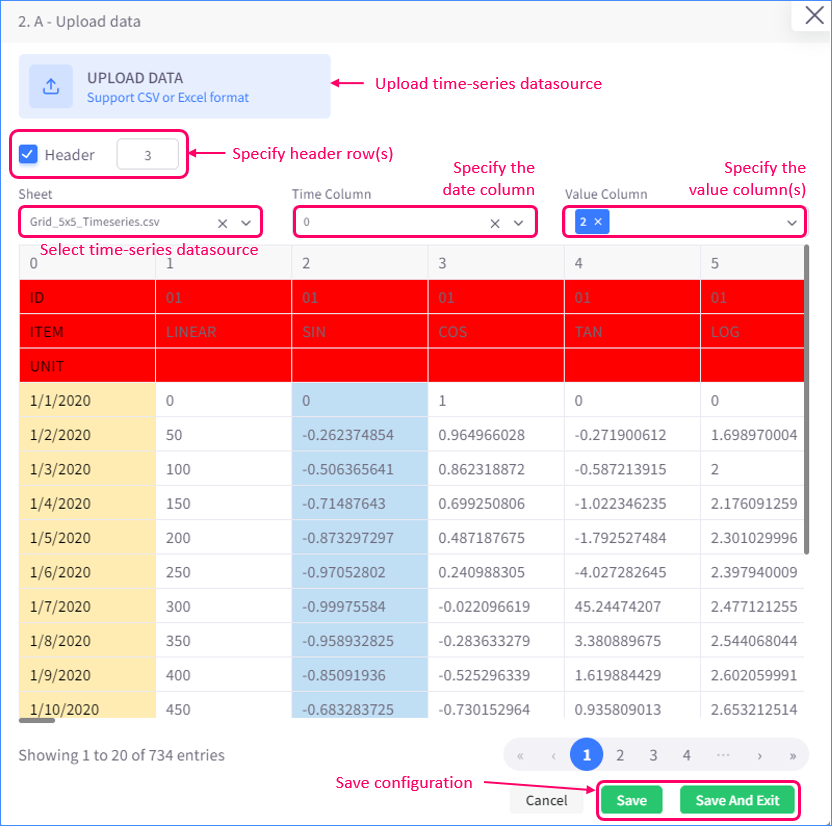
- Click UPLOAD DATA and select a time-series datasource to upload. MBTSL currently supports XLSX and CSV files.
When the uploading is finished, you can select it from the Sheet list to preview the content of selected datasource. If it's a XLSX file, all of its sheets will show up in the Sheet list separately. - Enable the Header option and specify the number of header rows to exclude those rows from data rows.
If an excluded row has keyword (which refers to first column's value) of "ITEM", "GROUP", or "UNIT" (not case-sensitive), that row will be used to fill in header information in the final data table. - Specify the date column by select a row from the Time Column list. If any cell in the selected column is not datetime data, the whole row will be excluded.
- Specify the value column(s) by select row(s) from the Value Column list. If any cell in the selected column is not number data, it will be marked as "NA".
- Click Save to save your configuration.
The validated data (or "final data") can be previewed in the "Time Series Files Import" menu. After you finish upload data for each station, review the final data and make sure required header's information (ITEM) is filled in.
Create layer
After timeseries data is ready, click Next to create a new layer using the location and timeseries data created at step 1 & 2 of MBTSL.
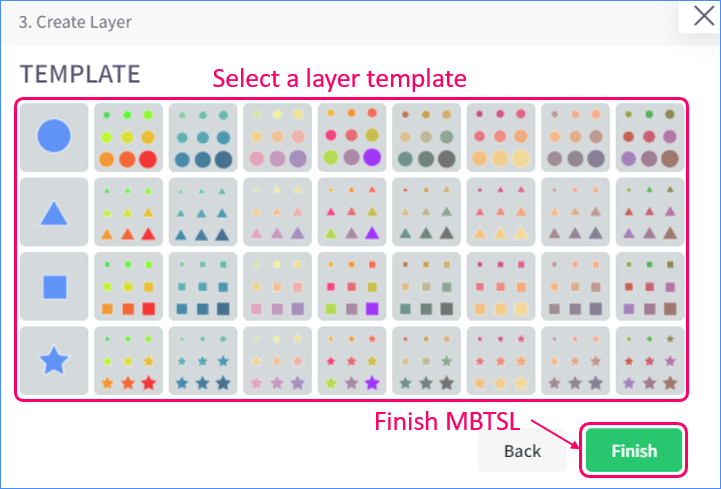
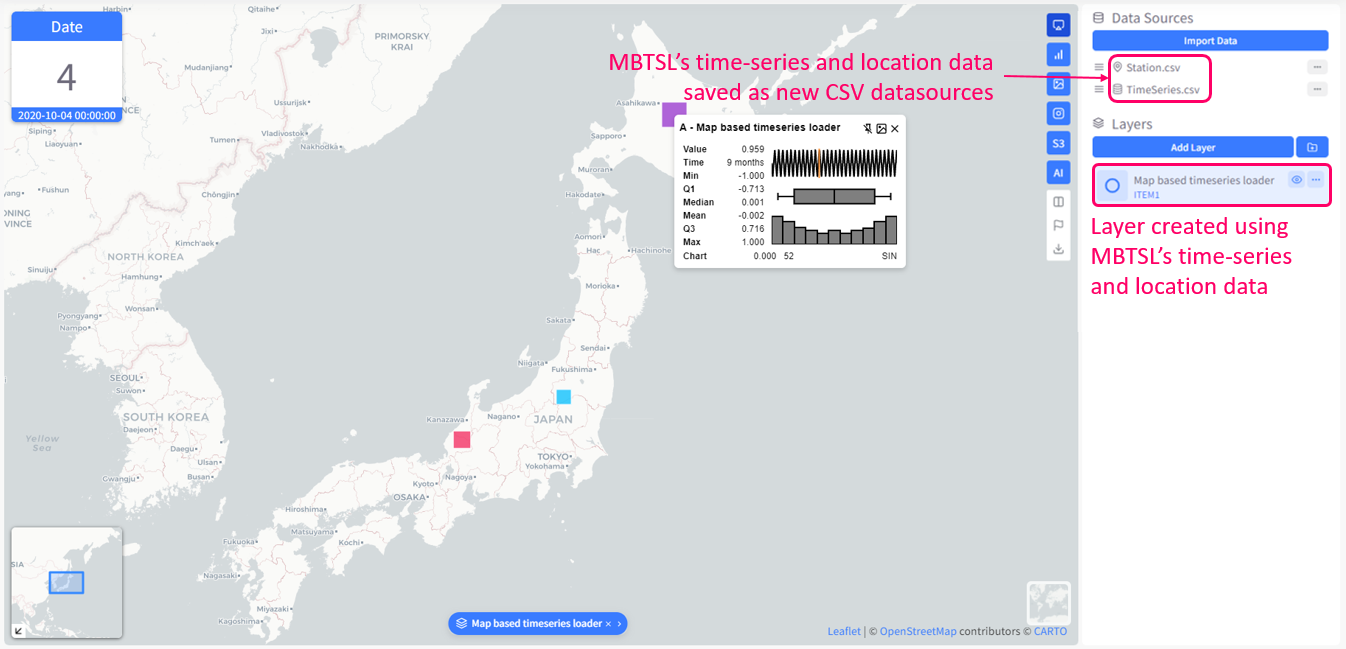
Select a template for the new layer and click Finish. This will create a new layer along with saving location and timeseries data as new CSV datasources (You can find the newly saved time-series datasource anywhere in Ecoplot because it is now usable just like any datasources that are imported into Ecoplot via Data Panel's Import Data)
You can go back to previous steps of MBTSL anytime you want to, as long as you haven't closed MBTSL by either finishing or canceling it.